Overview
This article summarizes the content on the Analyze page for a selected ACO.
 In this article
- Use Cases - A short list of what to look for
- Opening an ACO Analyze page - Two ways to open a specific ACO in the Analyze page
- ACO Analyze page Overview - the basic features of the ACO Analyze page
- Insights tab - the tiles include the most critical metrics to evaluate the selected ACO
- Destinations tab - this tab includes four tables that provide summary metrics for organizations participating in the ACO.
- Patient Population tab - this shows the location of residence, by county and state, for beneficiaries of the selected ACO
- Participating Providers tab - includes a table of physicians associated with the ACO
- PMPM Details - (Under Insights) - summary of the content on the PMPM details page
Use Cases
- see what hospitals, SNFs, home health, and hospice agencies beneficiaries go to
- assess relationships between agencies and the ACO via outcomes and reimbursement
- understand what counties have the most beneficiaries for the selected ACO
- see utilization for inpatient and post-acute settings to understand where there may be greater opportunity to lower readmissions, improve hospice utilization, and other favorable outcomes
- the roster of physicians affiliated with the ACO
- the physicians’ patient counts
- their patients’ post-acute utilization
Opening an ACO Analyze page
There are two ways to open the Analyze page for a specific ACO.
Option 1 - Global Search
At the top of every page there is a field labeled, "Search by ACO/Provider Name, Location, or ID." Type in the name of the ACO of interest.
![]()
Example
- To find Community Care of Brooklyn, we start by typing, "brook."
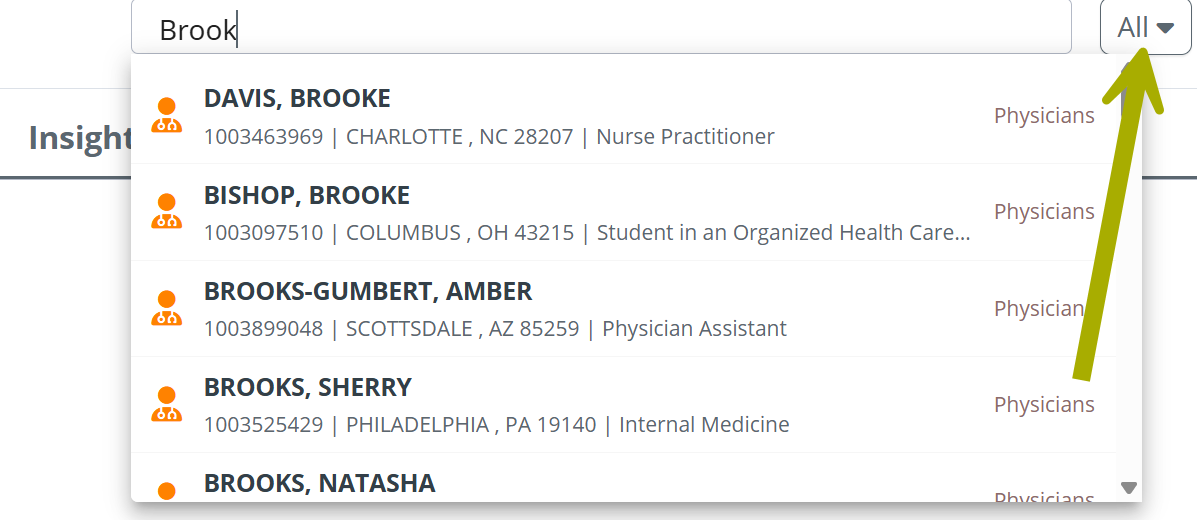
The first results include lots of physicians with "brook" in their names.
![]() If you scroll down a long way, the ACO we want to find is there. Using the filter will save us time.
If you scroll down a long way, the ACO we want to find is there. Using the filter will save us time.
- Click on the "All" dropdown and select, "ACO-MSSP."
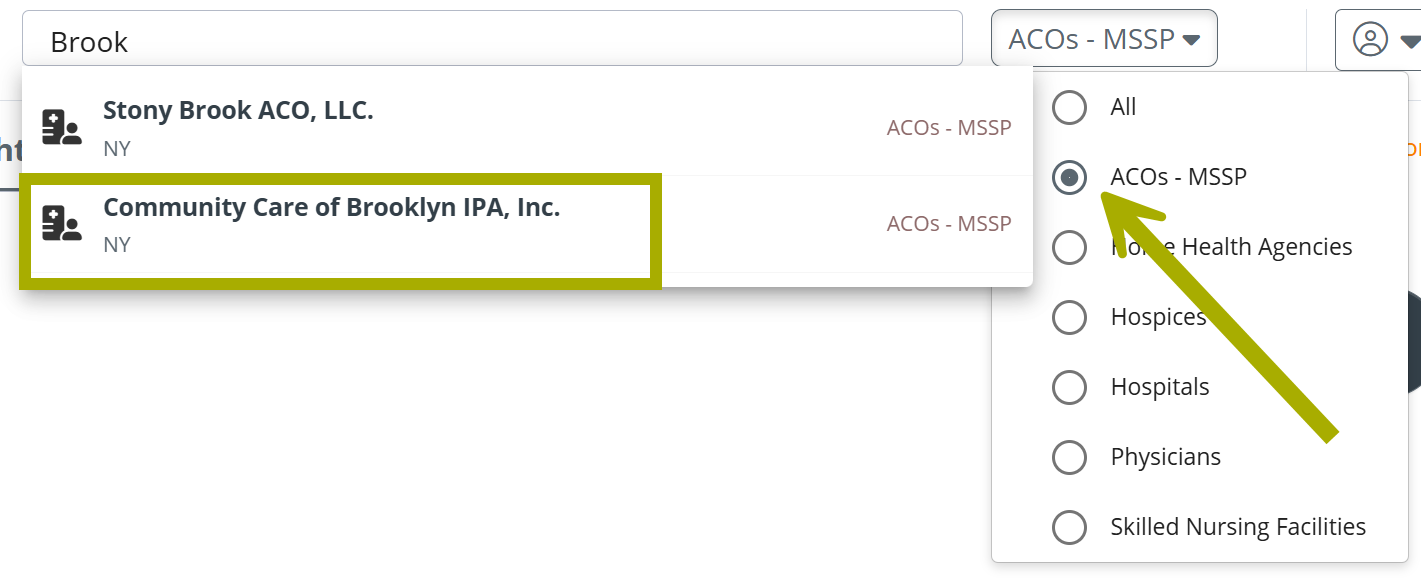
Our desired ACO is the second option. Click on the result in the list to open the Analyze page for Community Care of Brooklyn.
![]() The filter on the Global Search allows you to narrow the results of your search to all of the listed provider of facility types along with ACOs.
The filter on the Global Search allows you to narrow the results of your search to all of the listed provider of facility types along with ACOs.
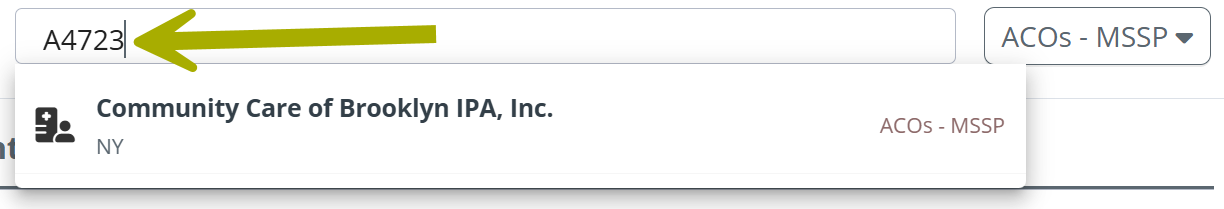
- If you know the ID for the ACO, you can type it in to the Global Search field to find the ACO in a single step.
Option 2 - Explore table - browse or search
The ACO Explore page has a table that includes every ACO. You can scroll through the table to find Community Care of Brooklyn or use the table search.
Use the image below to familiarize yourself with the table search.
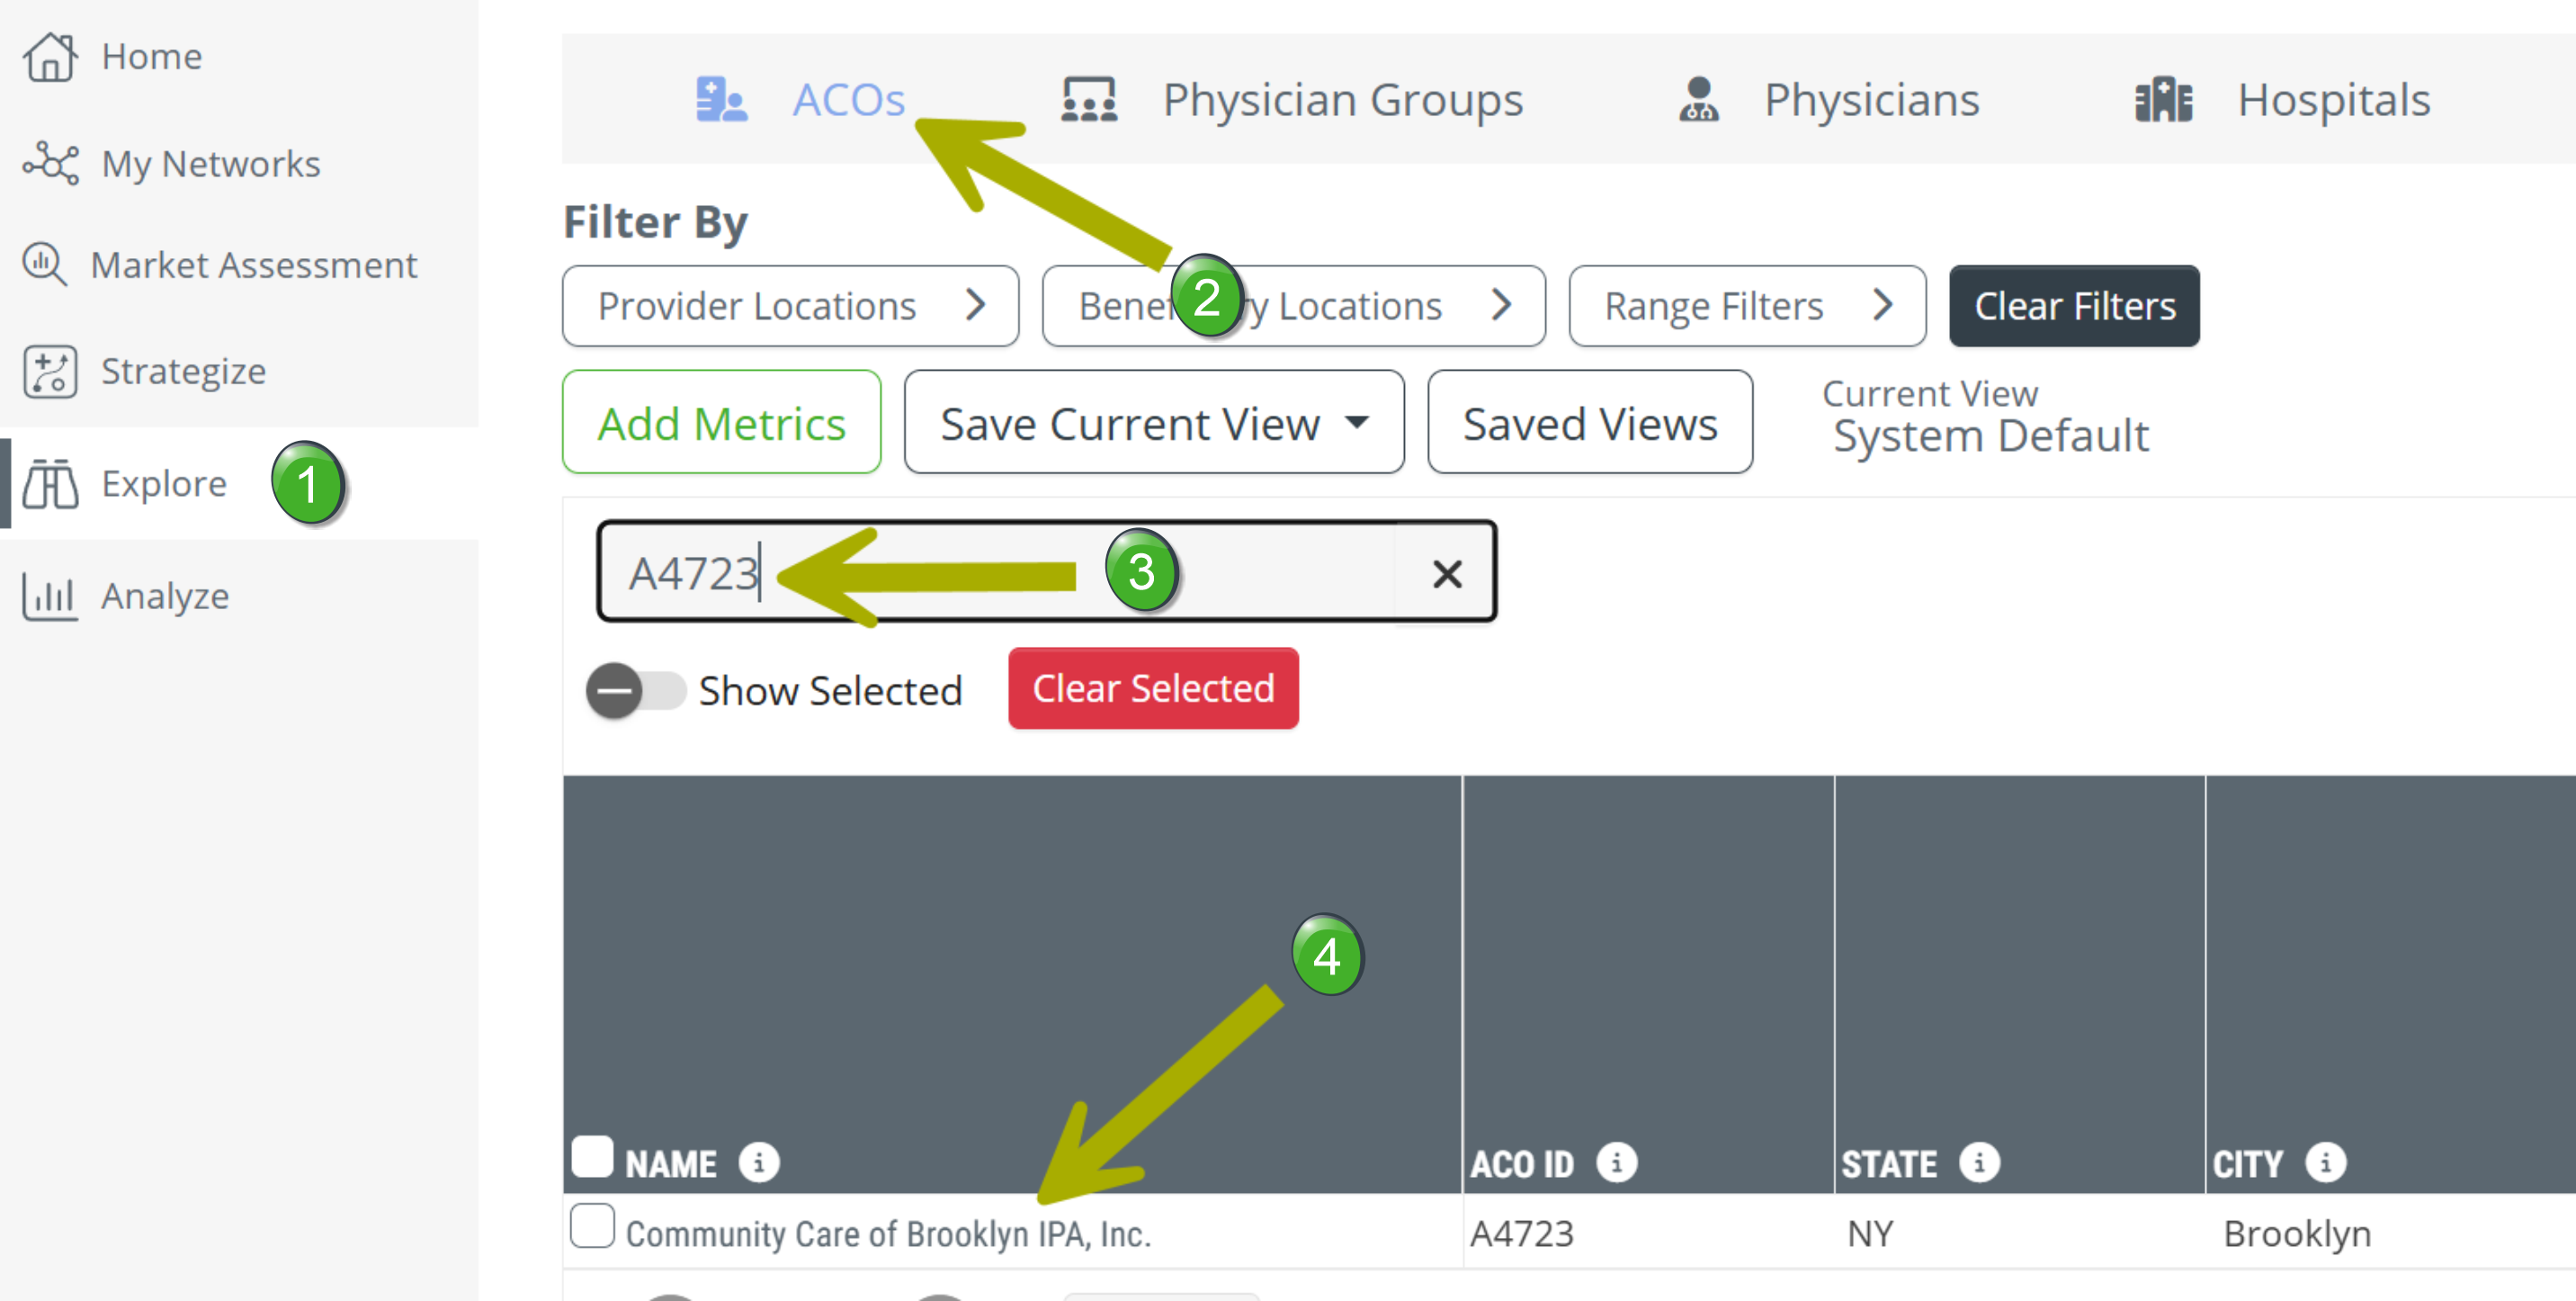
![]() Click on the "Explore" button in the left navigation to open the Explore page.
Click on the "Explore" button in the left navigation to open the Explore page.
![]() Click on "ACOs" In the tabs at the top of the page to open the ACO tab.
Click on "ACOs" In the tabs at the top of the page to open the ACO tab.
![]() Type in the name of the ACO, or, as in the example, the ACO ID.
Type in the name of the ACO, or, as in the example, the ACO ID.
![]() The name of the ACO in the table is a link that opens the Analyze page for the selected ACO.
The name of the ACO in the table is a link that opens the Analyze page for the selected ACO.
- Click on the name of the ACO you want to investigate.
Recently Viewed
If you have opened the Analyze page for the ACO in the past, you can click on the "Recently Viewed" icon near the top right of the page - ![]()
Any recently viewed entities will appear in the dropdown.
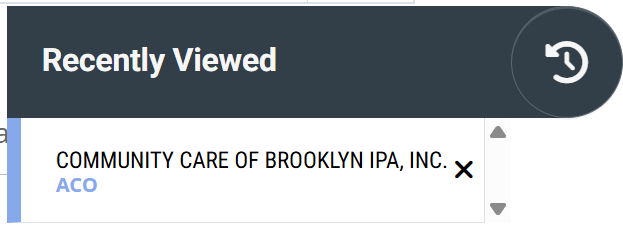
- Click on the entry for the desired ACO and the Analyze page for that ACO will open.
ACO Analyze Page Overview
The following image highlights the basic navigation tools for the page.
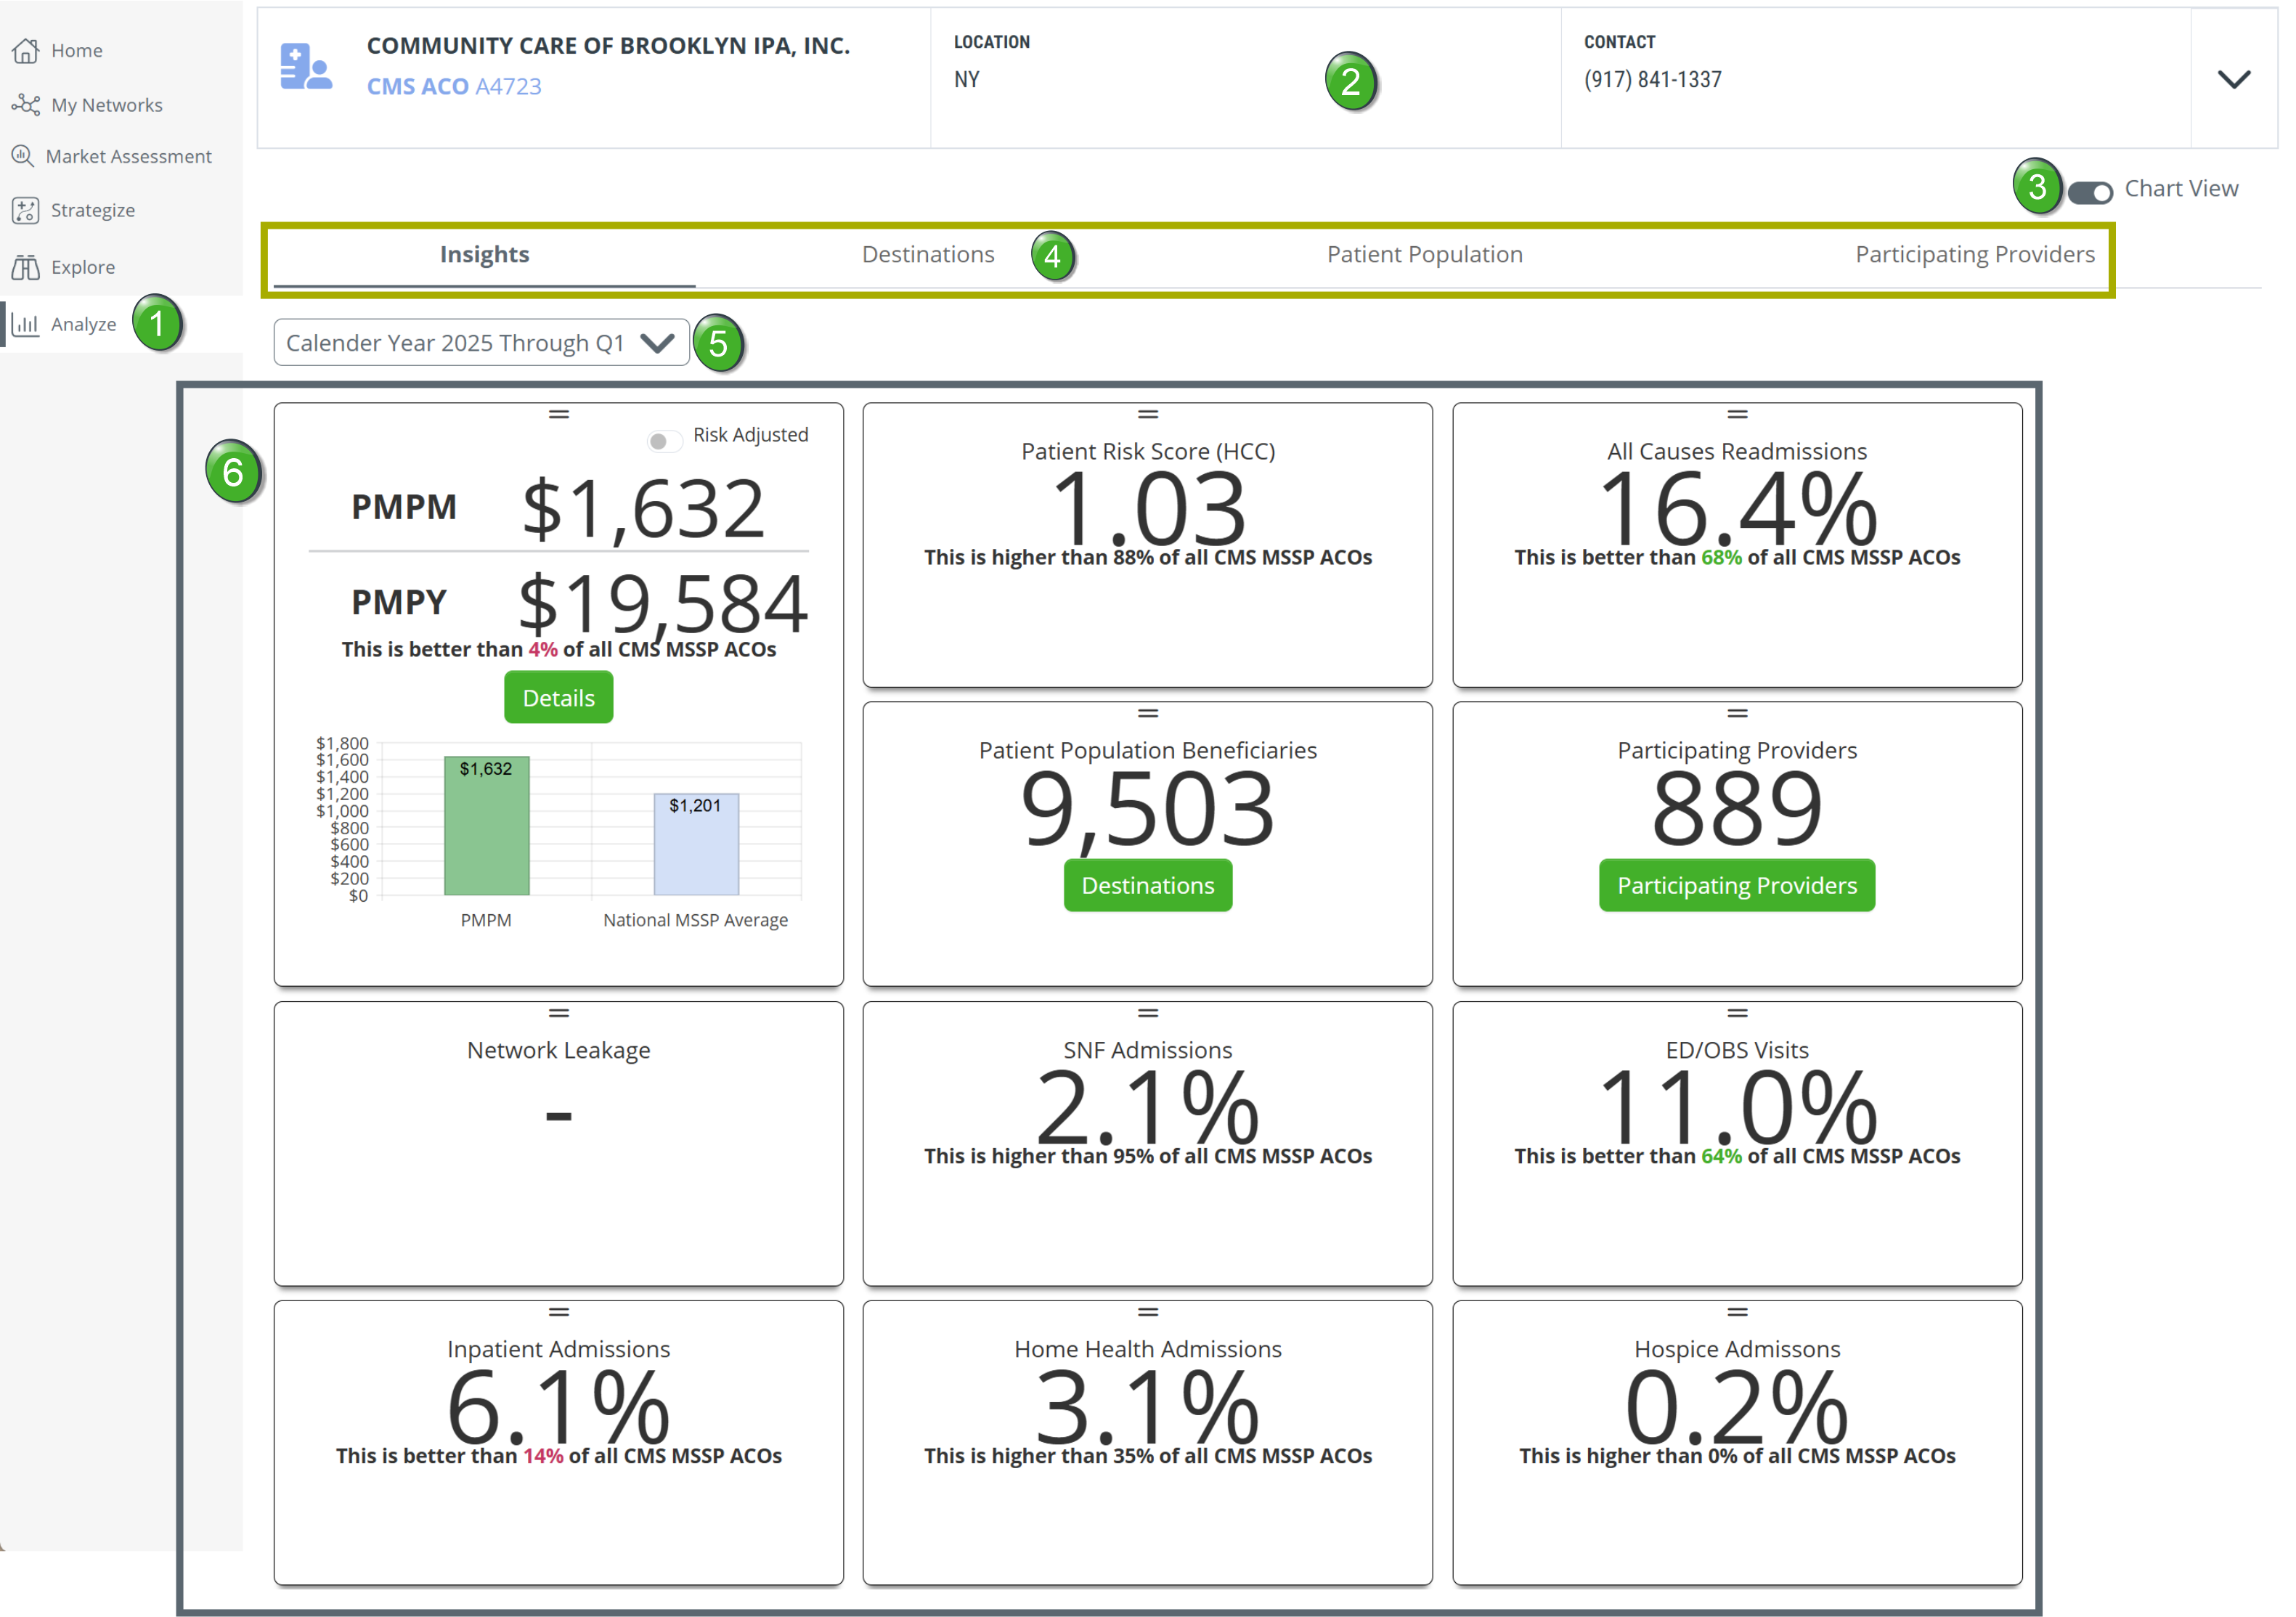
![]() Analyze button - The "Analyze" button is highlighted in the left navigation to confirm that the Analyze page is being viewed.
Analyze button - The "Analyze" button is highlighted in the left navigation to confirm that the Analyze page is being viewed.
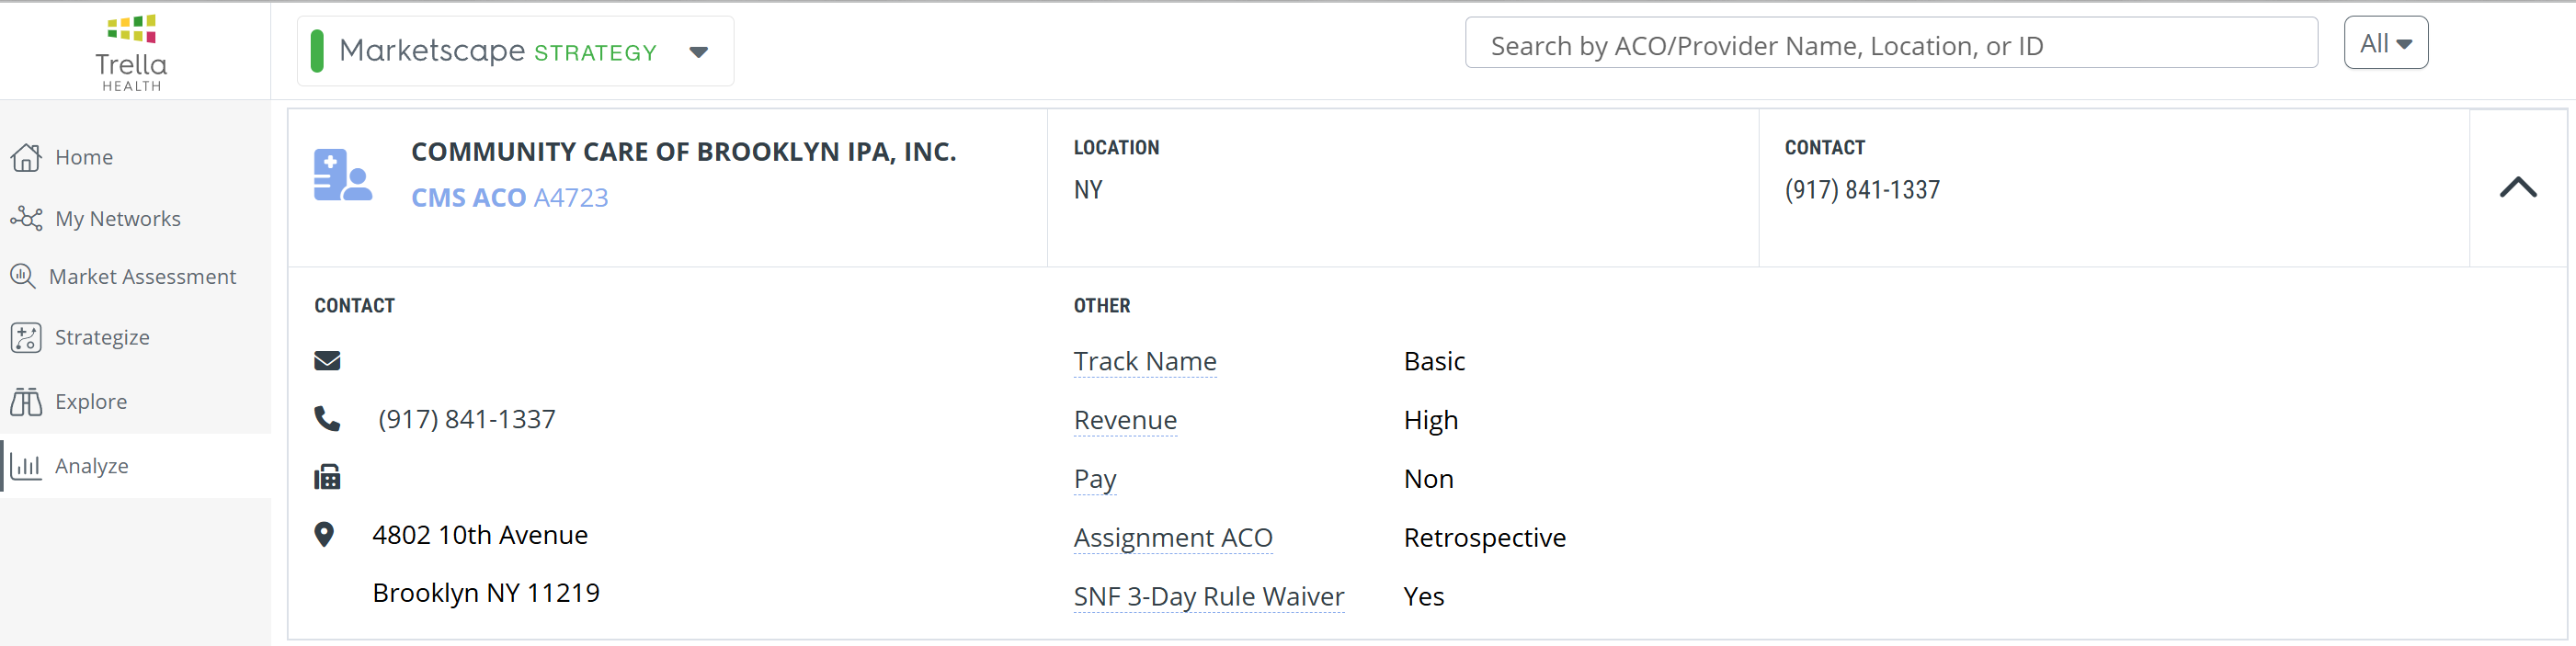
![]() Provider/ACO information - The top section of every Analyze page includes information on the selected provider/ACO. Click on the chevron at the right to open the information panel.
Provider/ACO information - The top section of every Analyze page includes information on the selected provider/ACO. Click on the chevron at the right to open the information panel. ![]()
The following image shows the type of information available when opening the panel.
![]() Chart View - Some of the tables on the Analyze page can be viewed as charts. Use the Chart View toggle to turn the charts on or off.
Chart View - Some of the tables on the Analyze page can be viewed as charts. Use the Chart View toggle to turn the charts on or off.

![]() Analyze page tabs - The ACO Analyze page is divided into four sections of content. Clicking on a tab will open the content contained under the selected tab.
Analyze page tabs - The ACO Analyze page is divided into four sections of content. Clicking on a tab will open the content contained under the selected tab.
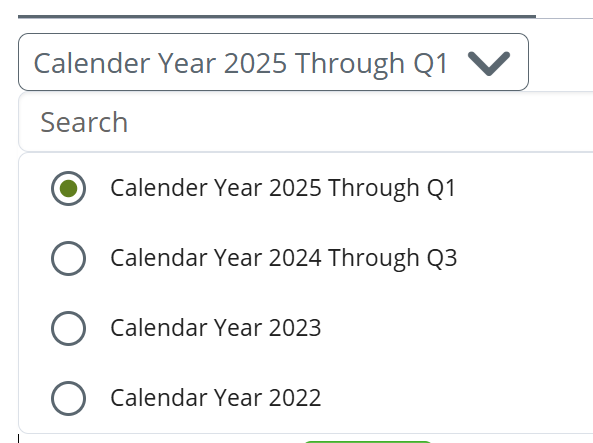
![]() Calendar Year dropdown - In order to track trends for the selected ACO, you can use the calendar dropdown to select different data reporting periods. The options will change depending on the latest data released.
Calendar Year dropdown - In order to track trends for the selected ACO, you can use the calendar dropdown to select different data reporting periods. The options will change depending on the latest data released.
![]() Insights tab - The Insights tab is the default tab and displays tiles with the most important metrics for the selected ACO.
Insights tab - The Insights tab is the default tab and displays tiles with the most important metrics for the selected ACO.
![]() The content included under each tab is described below. The follow links will take you to the content for a selected tab.
The content included under each tab is described below. The follow links will take you to the content for a selected tab.
Insights tab
The following image shows the spread of metrics displayed on and ACO Analyze page. A summary of each tile is included in the table below.
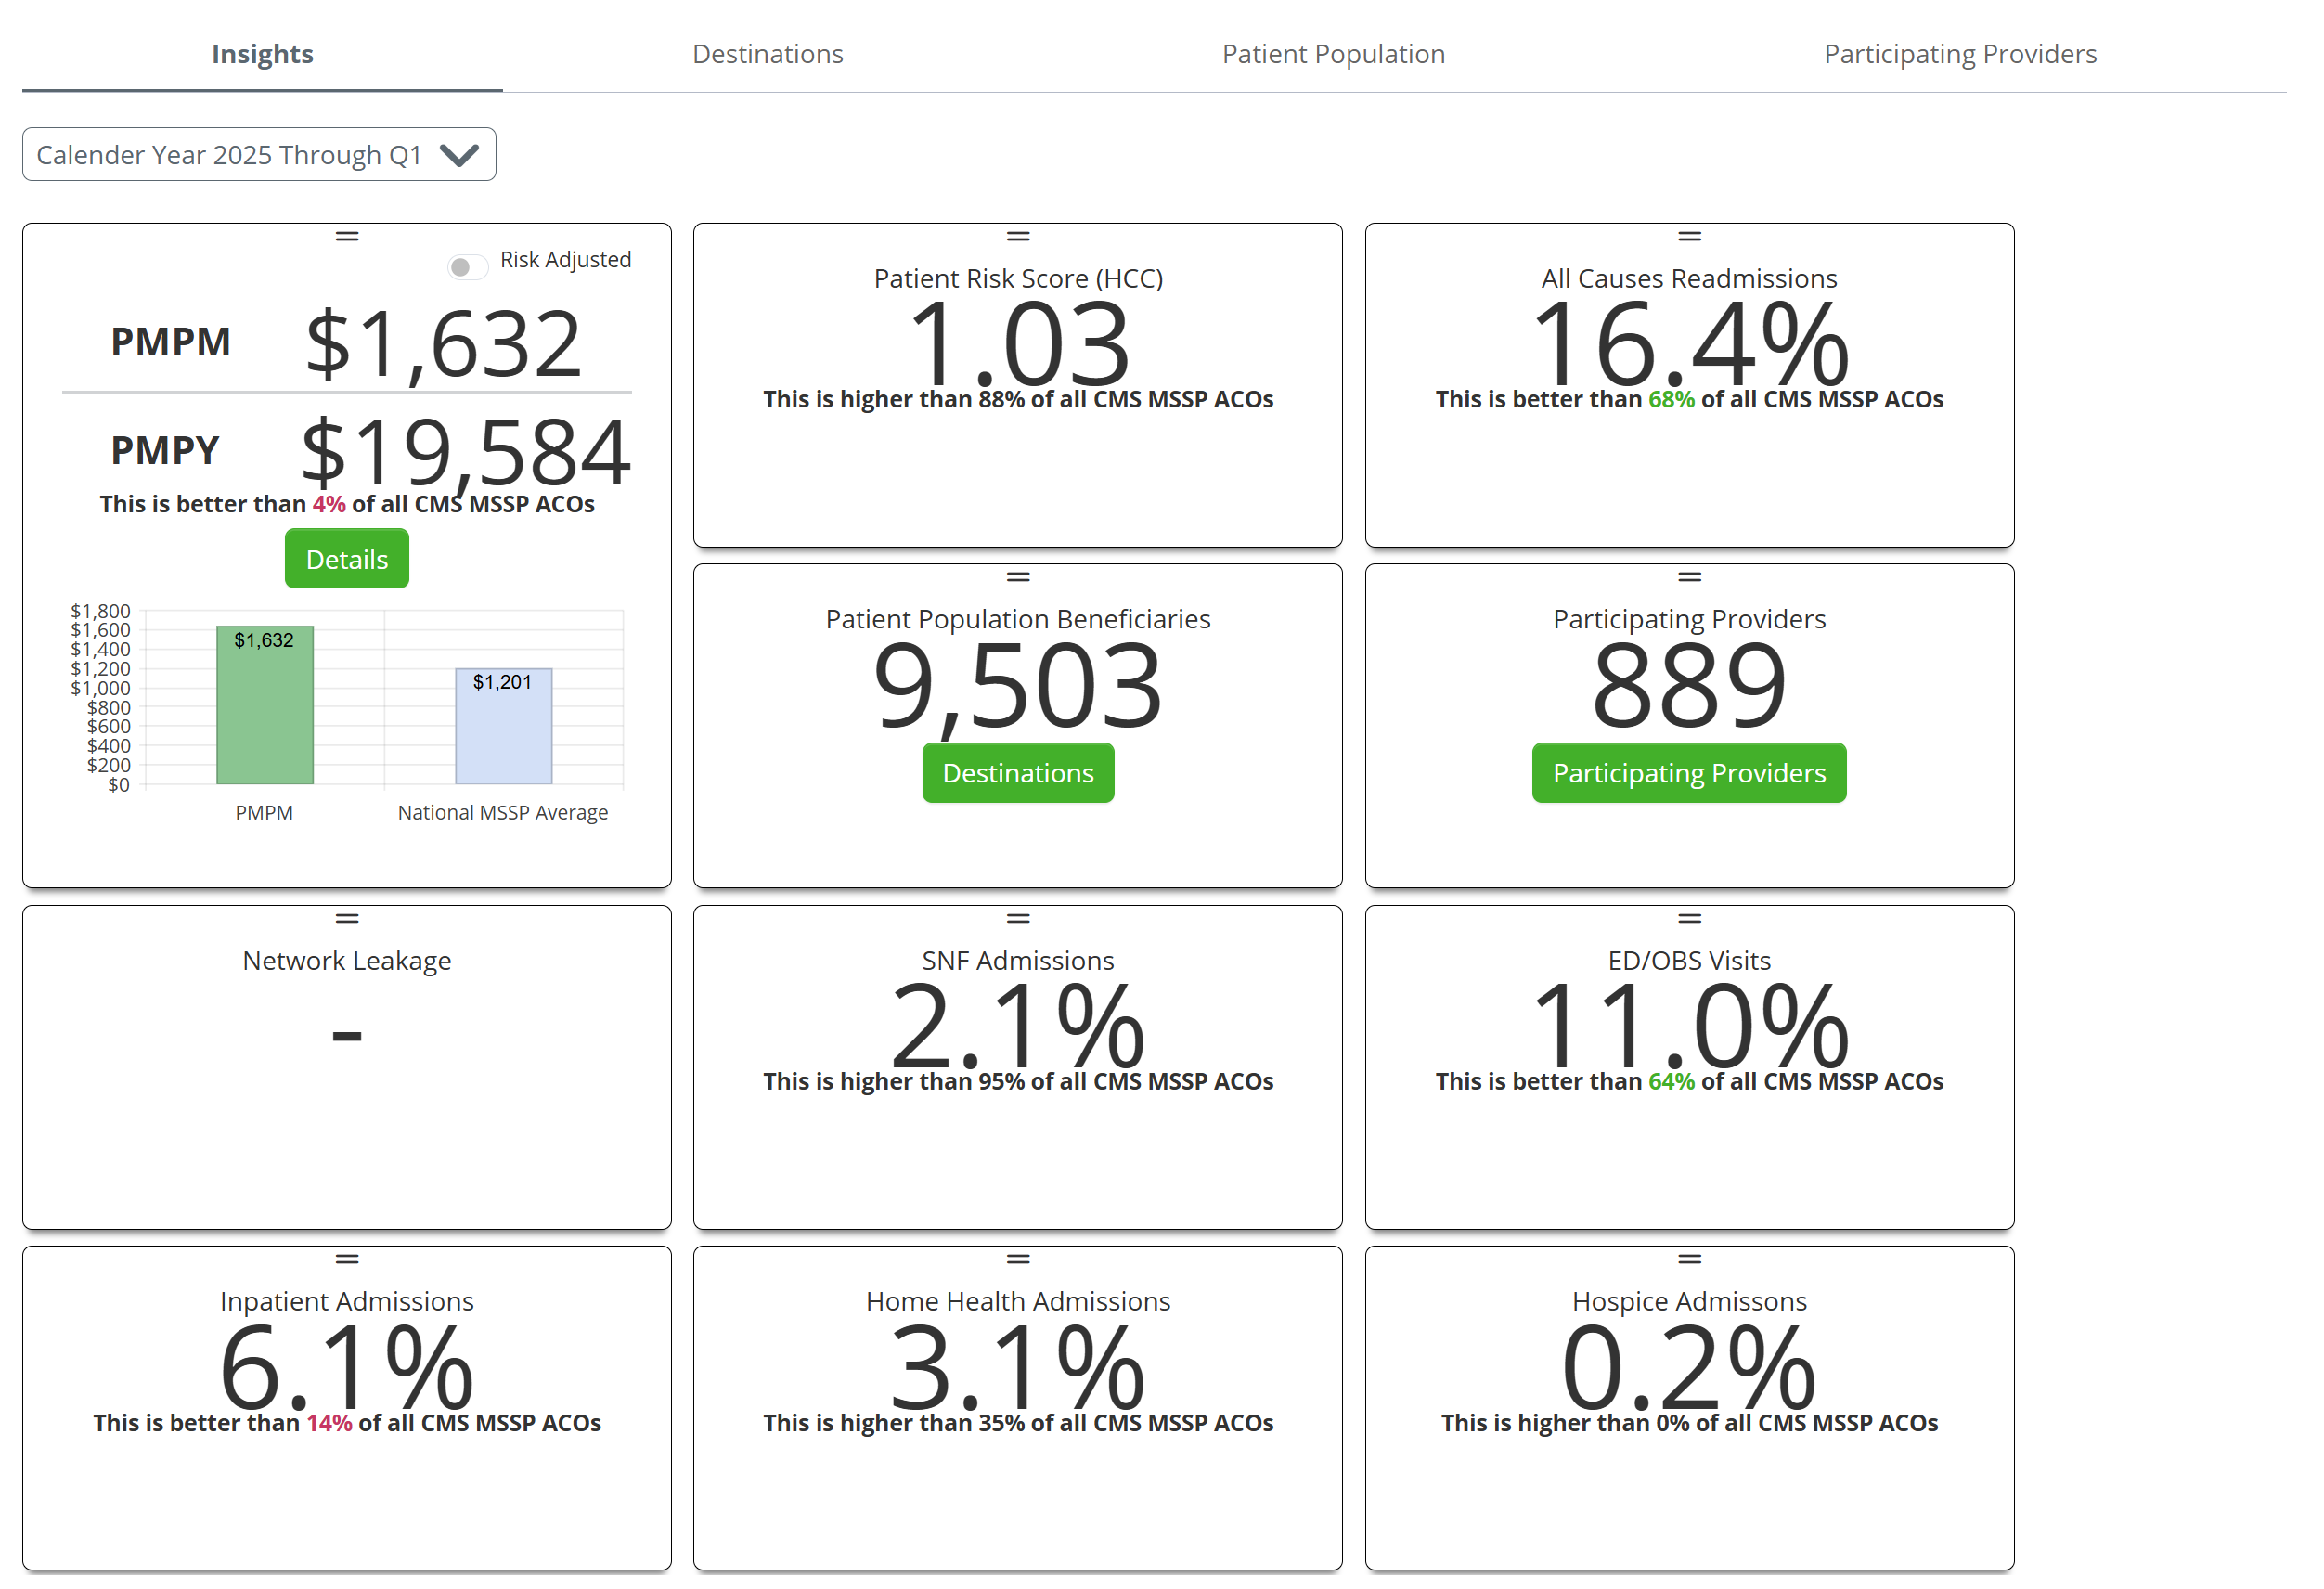
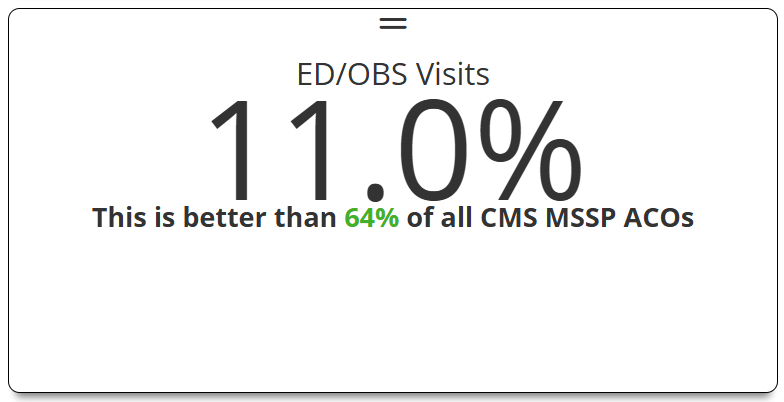
![]() The metrics displayed on these tiles are calculated for all beneficiaries of the selected ACO.
The metrics displayed on these tiles are calculated for all beneficiaries of the selected ACO.
| Metric Tile | Details |
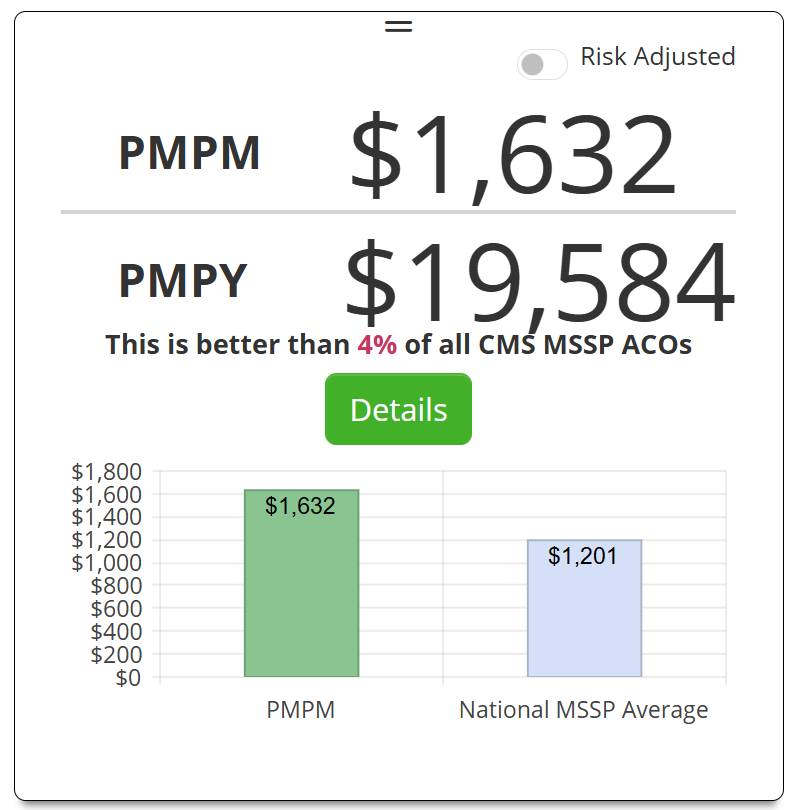 |
PMPM/PMPY
|
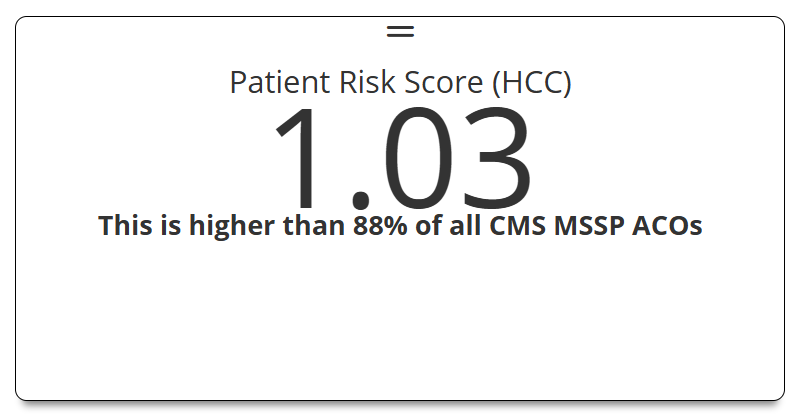 |
Patient Risk Score (HCC)
|
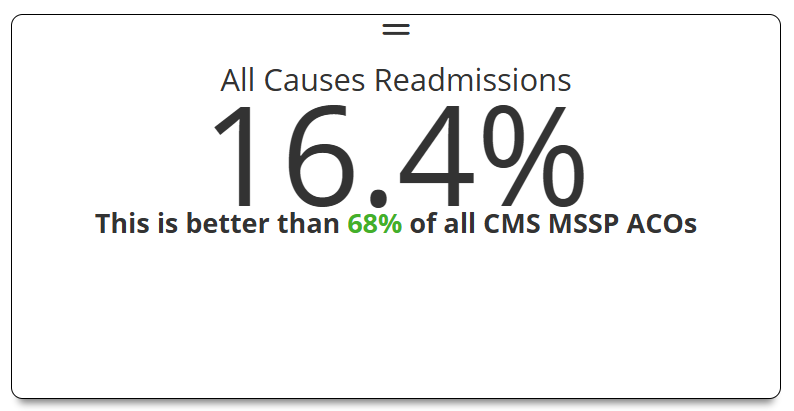 |
All Causes Readmissions
|
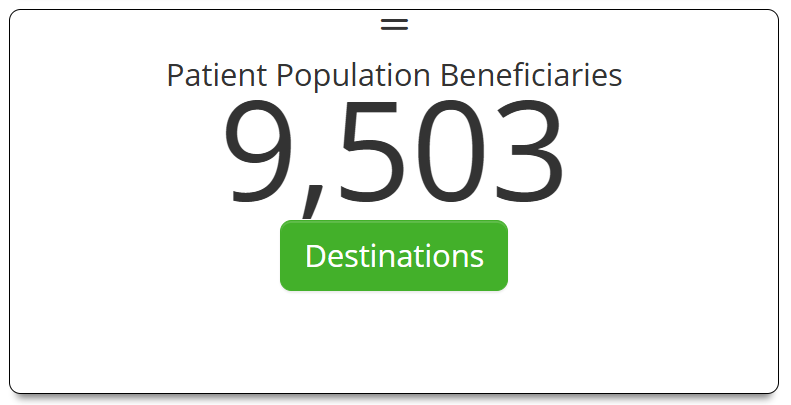 |
Patient Population Beneficiaries
|
|
|
Network Leakage
|
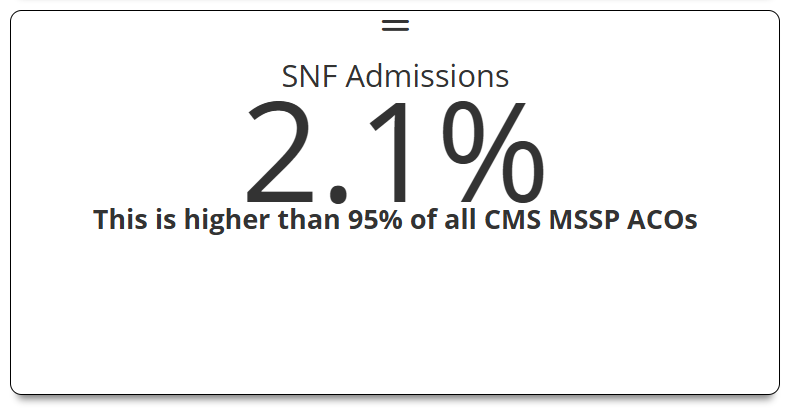 |
SNF Admissions
|
|
ED/OBS Visits
|
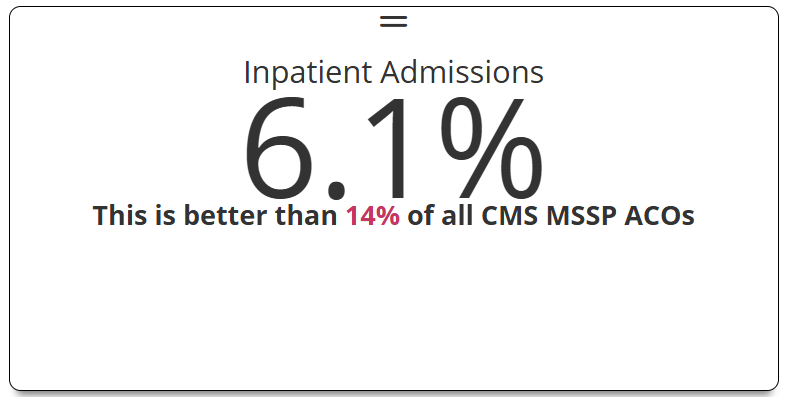 |
Inpatient Admissions
|
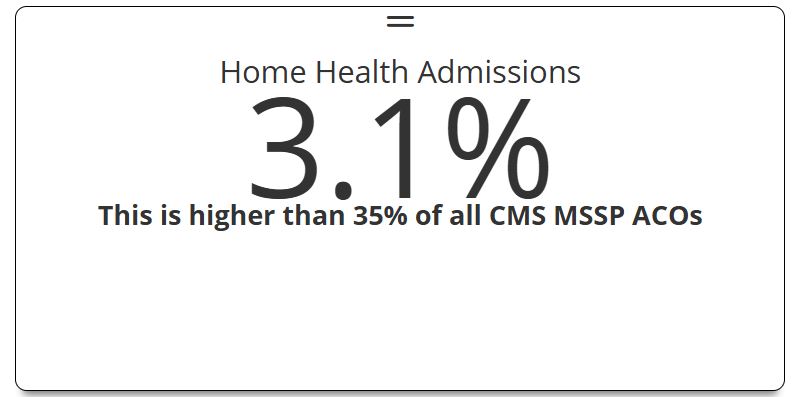 |
Home Health Admissions
|
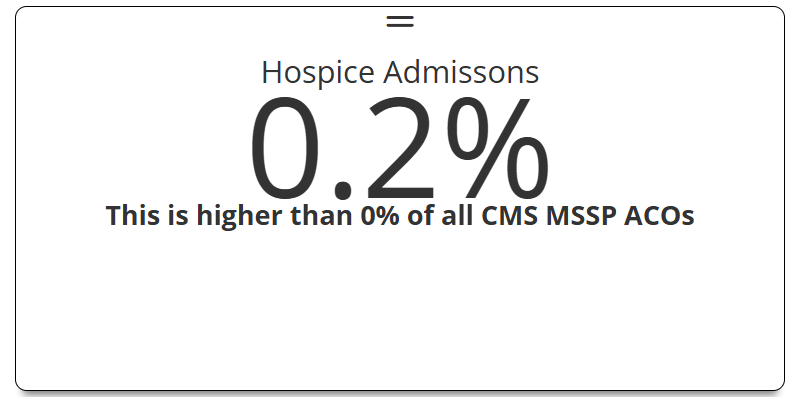 |
Hospice Admissions
|

Destinations
When you click on the "Destinations" tab, or on the "Destinations" button on the Patient Population Beneficiaries tile, either route will open the Destinations tab.
There are four tables on the Destinations tab.
![]() Click on the name of each table to navigate to the details for the table.
Click on the name of each table to navigate to the details for the table.
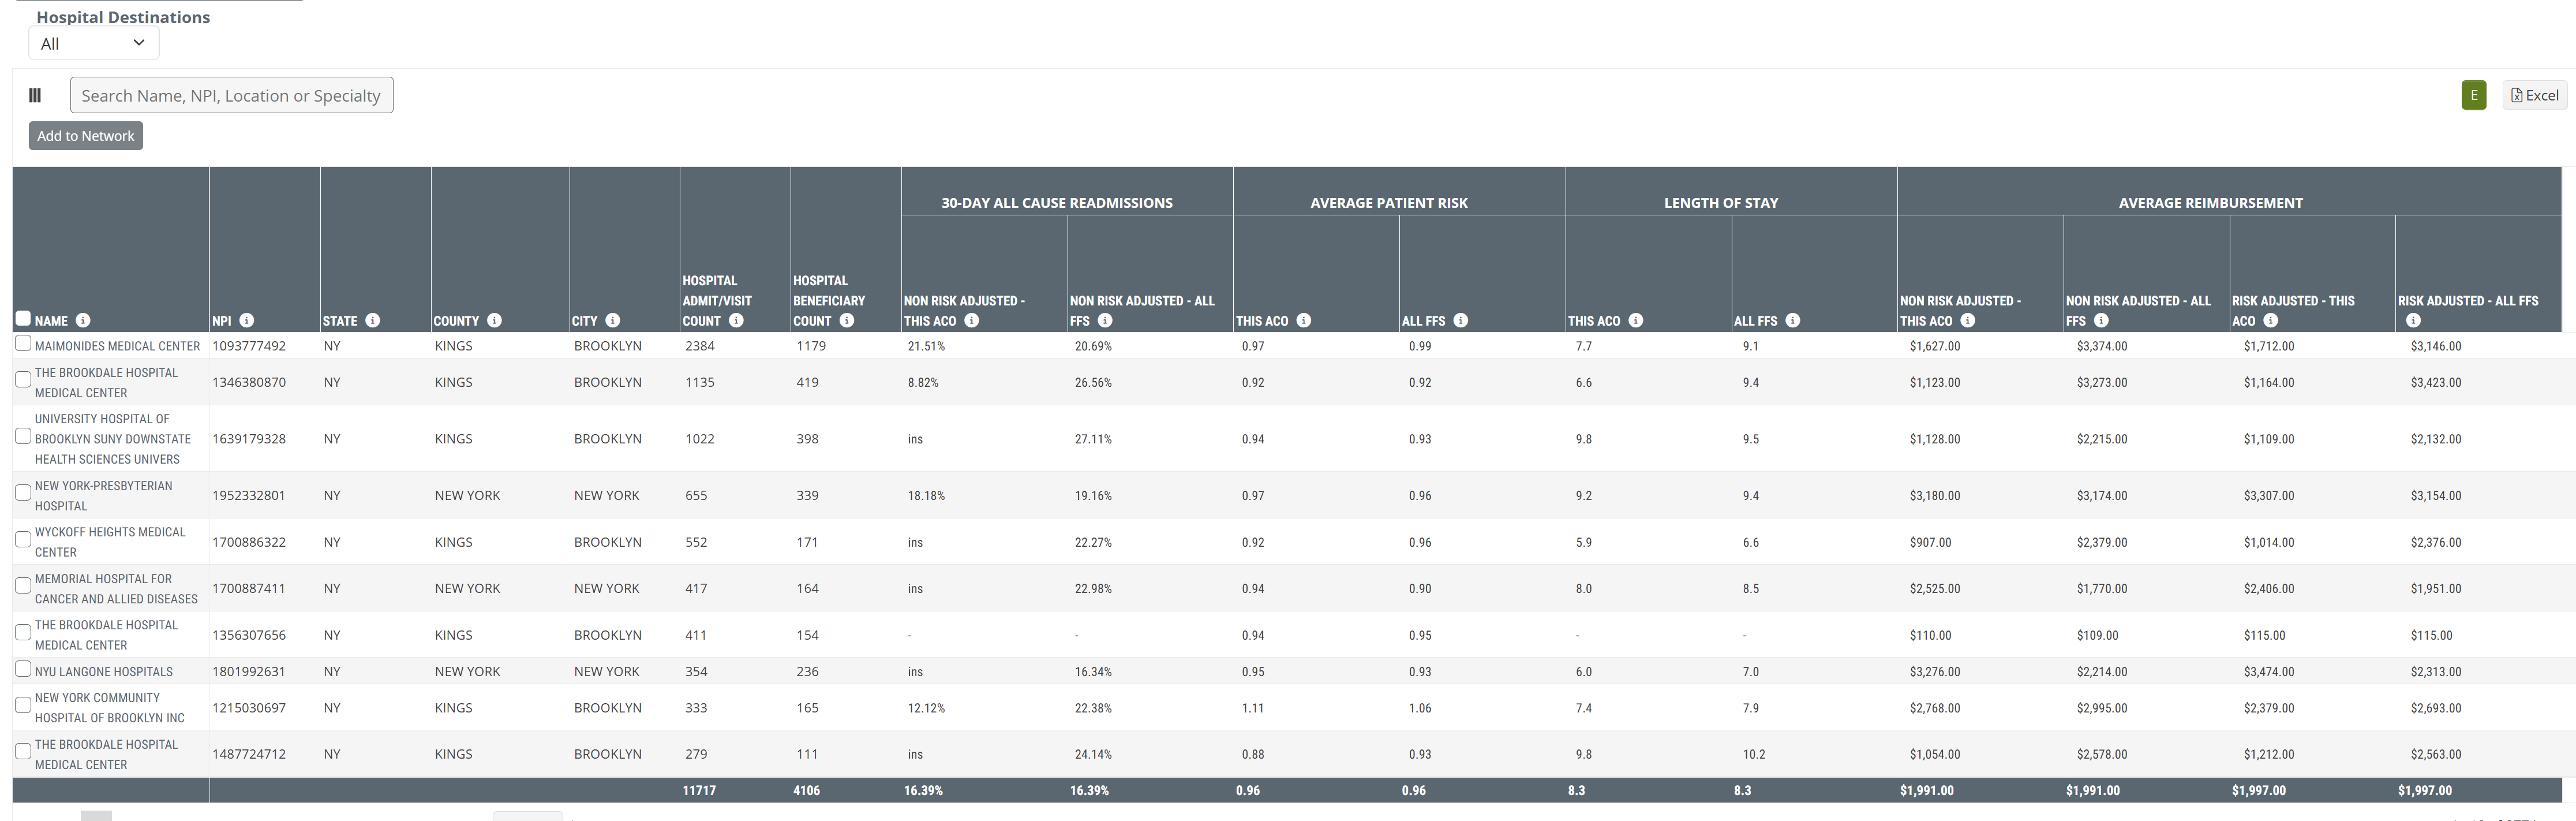
Hospital Destinations
Claim Type Dropdown
| The dropdown at the top-left of the table allows you to select the claim type from which the metrics in the table are calculated. | 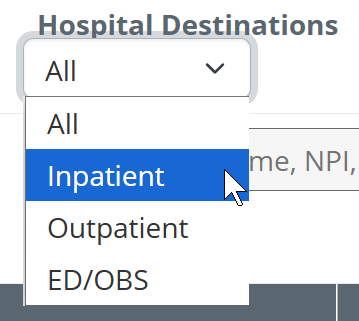 |
The following table includes a brief description of the metrics in the Hospital Destinations table.
| Column/Metric Name | Description | |
| Provider Identification | Name | Hospital name where the inpatient/outpatient claim was filed |
| NPI | NPI for listed provider | |
| State | State of the hospital where the listed facility claim was filed | |
| County | County of the hospital where the listed facility claim was filed | |
| City | City of the hospital where the listed facility claim was filed | |
| Hospital Admit/Visit Count | The count of inpatient admissions or outpatient claims for this ACO's assigned lives at the listed facility beginning during the selected time period | |
| Hospital Beneficiary Count | The count of the selected ACO's distinct assigned lives with inpatient admissions or outpatient claims at the listed facility during the selected time period | |
| 30-Day All Cause Readmissions | Non-Risk Adjusted - This ACO | The percentage of the selected ACO's assigned lives who were discharged from the listed facility during the selected time period and readmitted to any hospital within 30 days of discharge |
| Non-Risk Adjusted - All FFS | The percentage of patients who were readmitted to any hospital within 30 days of discharge from the listed facility | |
| Average Patient Risk | This ACO | Average Hierarchical Condition Category (HCC) Patient Risk Score for the selected ACO's assigned lives admitted to the listed facility during the selected time period |
| All FFS | Average Hierarchical Condition Category (HCC) Patient Risk Score for patients admitted to the listed facility during the selected time period | |
| Length of Stay | This ACO | The average length of inpatient stay (in days) for the selected ACO's assigned lives who were admitted to and discharged from the listed hospital during the selected time period |
| All FFS | The average length of inpatient stay (in days) for all patients admitted to and discharged from the listed hospital during the selected time period | |
| Average Reimbursement | Non-Risk Adjusted - This ACO | Average Medicare spend per inpatient admission/outpatient claim for the selected ACO's assigned lives with visits or admissions to the listed facility beginning during the selected time period |
| Non-Risk Adjusted - All FFS | Average Medicare spend per inpatient admission/outpatient claim for all patients with visits/admissions to the listed facility beginning during the selected time period | |
| Risk Adjusted - This ACO | Average risk-adjusted Medicare spend per inpatient admission/outpatient claim for the selected ACO's assigned lives with visits or admissions to the listed facility beginning during the selected time period | |
| Risk Adjusted - All FFS | Average risk-adjusted Medicare spend per inpatient admission/outpatient claim for all patients with visits/admissions to the listed facility beginning during the selected time period |
SNF Destinations
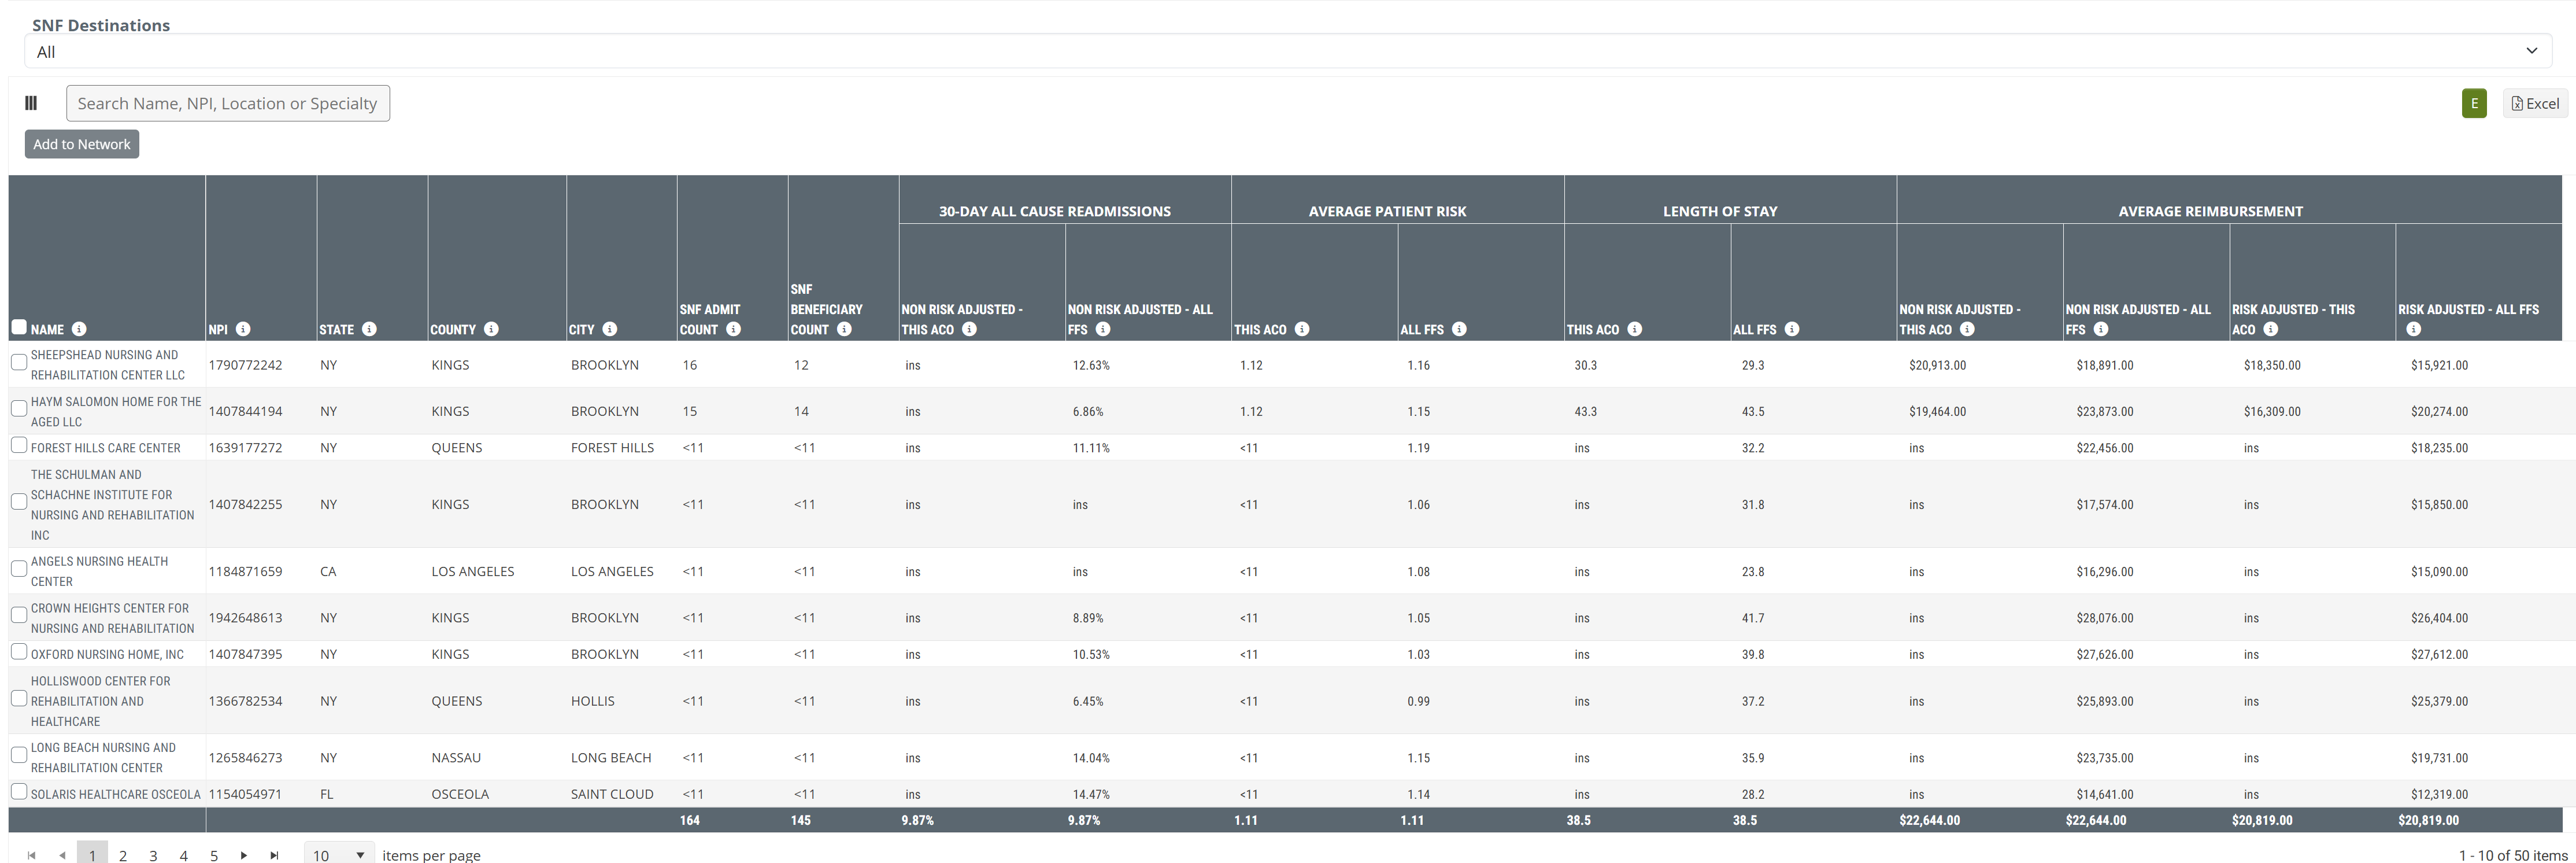
Claim Type Dropdown
| The dropdown at the top-left of the table allows you to select the claim type from which the metrics in the table are calculated. | 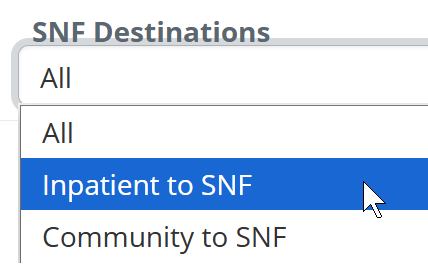 |
| Column/Metric Name | Description | |
| Provider Identification | Name | Organization name where the SNF claim was filed |
| NPI | NPI for listed provider | |
| State | State of the SNF where the listed facility claim was filed | |
| County | County of the SNF where the listed facility claim was filed | |
| City | City of the SNF where the listed facility claim was filed | |
| SNF Admit Count | Count of skilled nursing admissions for this ACO's assigned lives at the listed SNF during the selected time period | |
| SNF Beneficiary Count | Count of this ACO's distinct assigned lives admitted to the listed facility during the selected time period | |
| 30-Day All Cause Readmissions | Non-Risk Adjusted - This ACO | Percentage of the selected ACO's assigned lives who were discharged from an inpatient setting into the listed SNF during the selected time period and readmitted to any inpatient setting within 30 days of the first inpatient discharge |
| Non-Risk Adjusted - All FFS | Percentage of patients who came from an inpatient setting into the listed SNF and were subsequently readmitted to any inpatient setting within 30 days of the first inpatient discharge | |
| Average Patient Risk | This ACO | Average Hierarchical Condition Category (HCC) Patient Risk Score for the selected ACO's assigned lives admitted to the listed SNF during the selected time period |
| All FFS | Average Hierarchical Condition Category (HCC) Patient Risk Score for patients admitted to the listed SNF during the selected time period | |
| Length of Stay | This ACO | Average length of skilled nursing stay (in days) for the selected ACO's assigned lives who were admitted to and discharged from the listed SNF during the selected time period |
| All FFS | Average length of skilled nursing stay (in days) for all patients admitted to and discharged from the listed SNF during the selected time period | |
| Average Reimbursement | Non-Risk Adjusted - This ACO | Average Medicare spend per admission for the selected ACO's assigned lives admitted to the listed SNF during the selected time period |
| Non-Risk Adjusted - All FFS | Average Medicare spend per admission for all patients admitted to the listed SNF during the selected time period | |
| Risk Adjusted - This ACO | Average risk-adjusted Medicare spend per admission for the selected ACO's assigned lives admitted to the listed SNF during the selected time period | |
| Risk Adjusted - All FFS | Average risk-adjusted Medicare spend per admission for all patients admitted to the listed SNF during the selected time period |
HHA Destinations
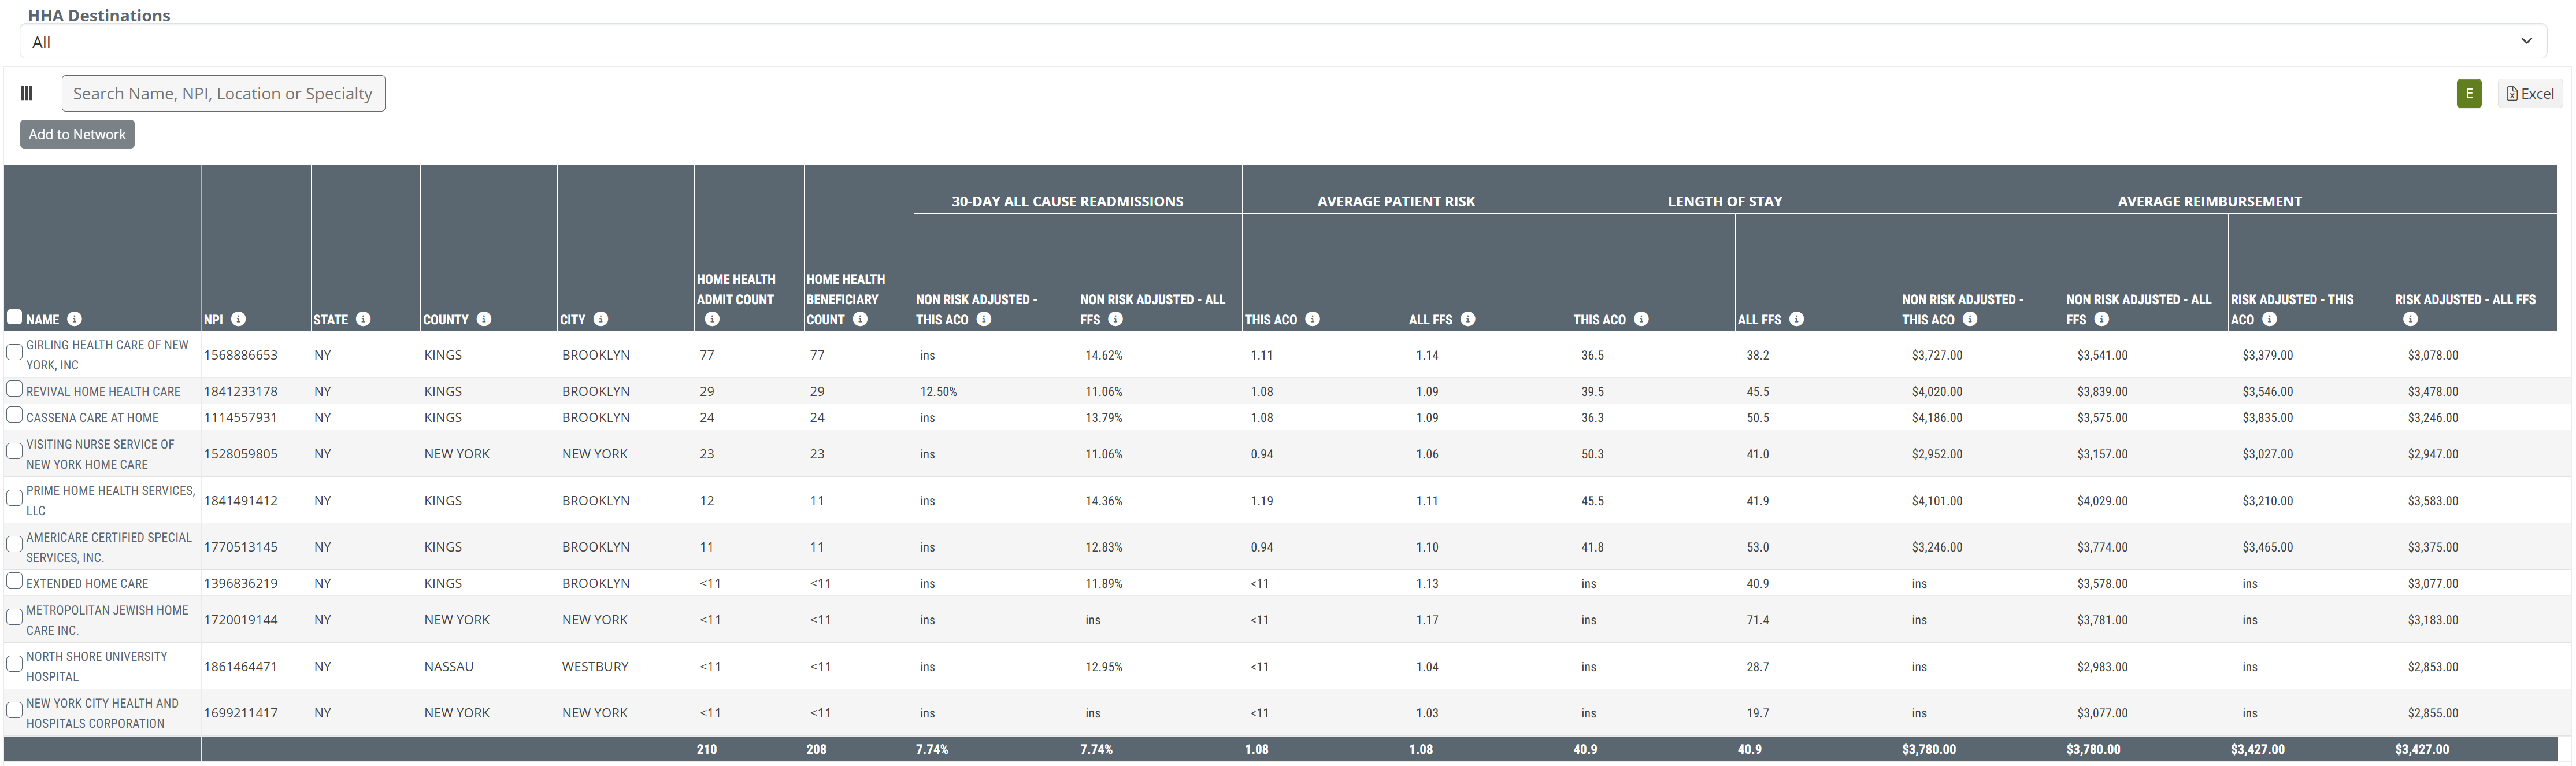
Claim Type Dropdown
| The dropdown at the top-left of the table allows you to select the claim type from which the metrics in the table are calculated. | 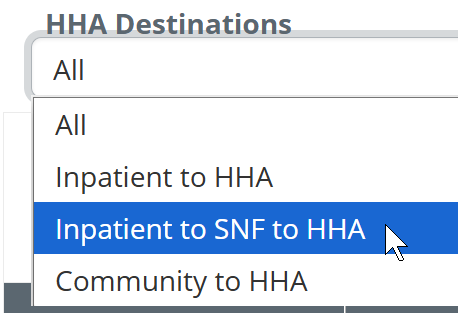 |
| Column/Metric Name | Description | |
| Provider Identification | Name | Organization name where the home health claim was filed |
| NPI | NPI for listed provider | |
| State | State of the home health agency where the listed facility claim was filed | |
| County | County of the home health agency where the listed facility claim was filed | |
| City | City of the home health agency where the listed facility claim was filed | |
| Home health Admit Count | Count of home health admissions for the selected ACO's assigned lives to the listed home health agency during the selected time period | |
| Home health Beneficiary Count | Count of the selected ACO's distinct assigned lives admitted to the listed home health agency during the selected time period | |
| 30-Day All Cause Readmissions | Non-Risk Adjusted - This ACO | Percentage of the selected ACO's assigned lives who were discharged from an inpatient setting into the listed home health agency during the selected time period and readmitted to any inpatient setting within 30 days of the first inpatient discharge |
| Non-Risk Adjusted - All FFS | Percentage of patients discharged from any inpatient setting into the listed home health agency and subsequently readmitted to any inpatient setting within 30 days of the first inpatient discharge | |
| Average Patient Risk | This ACO | Average Hierarchical Condition Category (HCC) Patient Risk Score for the selected ACO's assigned lives admitted to the listed home health agency during the selected time period |
| All FFS | Average Hierarchical Condition Category (HCC) Patient Risk Score for patients admitted to the listed home health agency during the selected time period | |
| Length of Stay | This ACO | Average length of home health stay (in days) for the selected ACO's assigned lives who were admitted to and discharged from the listed home health agency during the selected time period |
| All FFS | Average length of home health stay (in days) for all patients admitted to and discharged from the listed home health agency during the selected time period | |
| Average Reimbursement | Non-Risk Adjusted - This ACO | Average Medicare spend per admission for the selected ACO's assigned lives admitted to the listed home health agency during the selected time period |
| Non-Risk Adjusted - All FFS | Average Medicare spend per admission for all patients admitted to the listed home health agency during the selected time period | |
| Risk Adjusted - This ACO | Average risk-adjusted Medicare spend per admission for the selected ACO's assigned lives admitted to the listed home health agency during the selected time period | |
| Risk Adjusted - All FFS | Average risk-adjusted Medicare spend per admission for all patients admitted to the listed home health agency during the selected time period |
Hospice Destinations
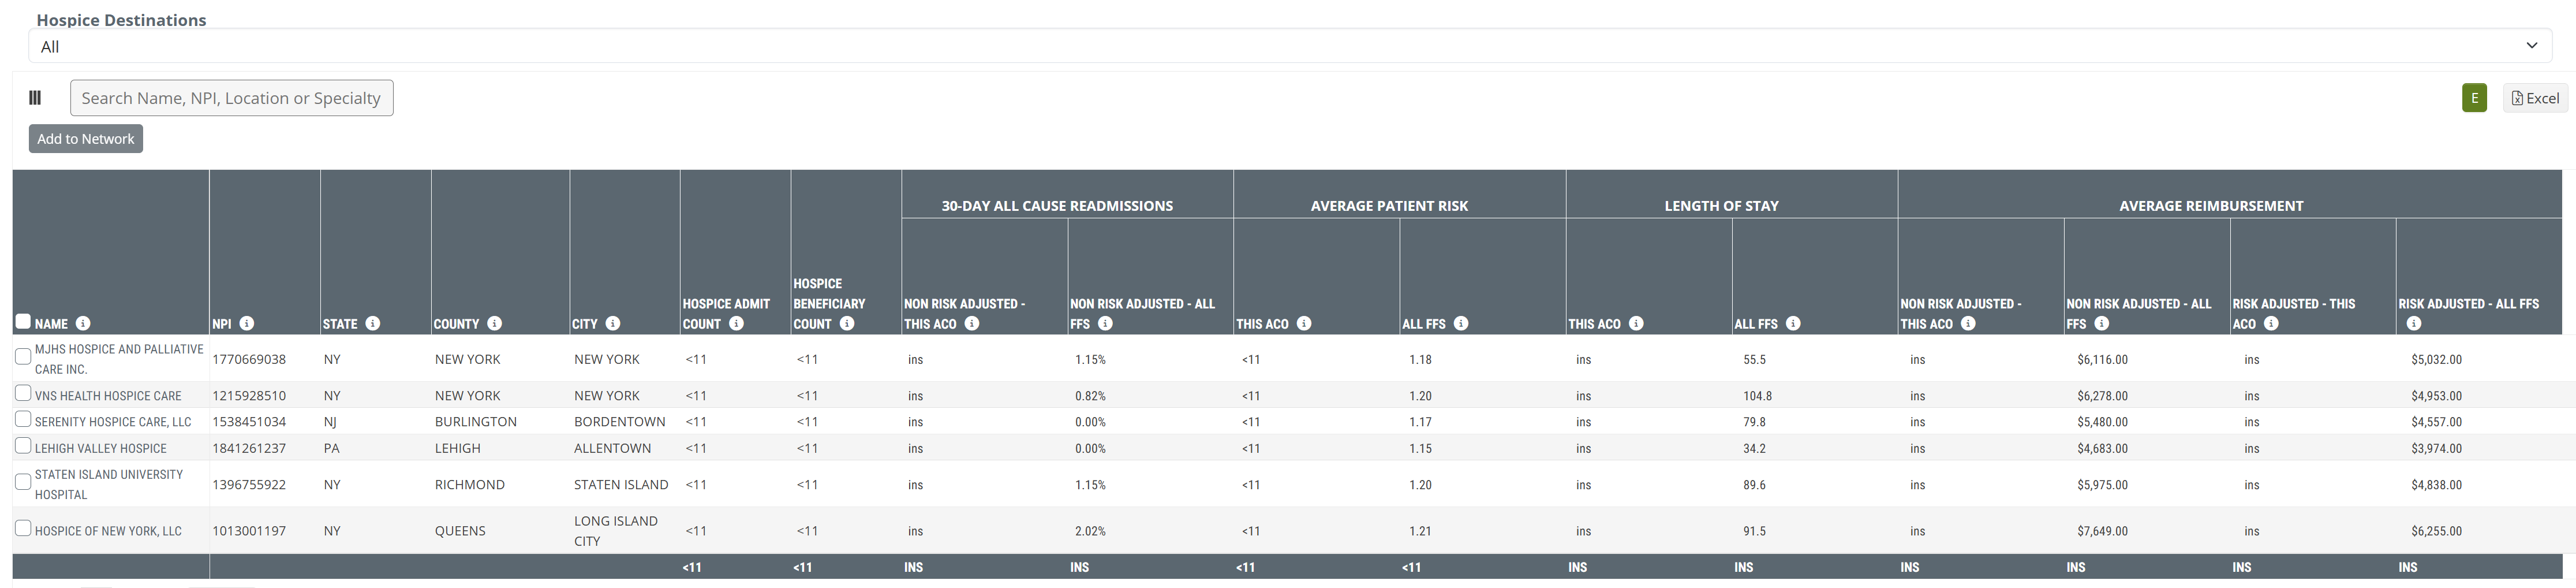
Claim Type Dropdown
| The dropdown at the top-left of the table allows you to select the claim type from which the metrics in the table are calculated. | |
| Column/Metric Name | Description | |
| Provider Identification | Name | Organization name where the hospice claim was filed |
| NPI | NPI for listed provider | |
| State | State of the hospice where the listed facility claim was filed | |
| County | County of the hospice where the listed facility claim was filed | |
| City | City of the hospice where the listed facility claim was filed | |
| Hospice Admit Count | Count of hospice admissions for the selected ACO's assigned lives at the listed hospice during the selected time period | |
| Hospice Beneficiary Count | Count of this ACO's distinct assigned lives admitted to the listed hospice during the selected time period | |
| 30-Day All Cause Readmissions | Non-Risk Adjusted - This ACO | Percentage of the selected ACO's assigned lives who were discharged from an inpatient setting into the listed hospice during the selected time period and readmitted to any inpatient setting within 30 days of the first inpatient discharge |
| Non-Risk Adjusted - All FFS | Percentage of patients discharged from any inpatient setting into the listed hospice and subsequently readmitted to any inpatient setting within 30 days of the first inpatient discharge | |
| Average Patient Risk | This ACO | Average Hierarchical Condition Category (HCC) Patient Risk Score for the selected ACO's assigned lives admitted to the listed hospice during the selected time period |
| All FFS | Average Hierarchical Condition Category (HCC) Patient Risk Score for patients admitted to the listed hospice during the selected time period | |
| Length of Stay | This ACO | Average length of home health stay (in days) for the selected ACO's assigned lives who were admitted to and discharged from the listed hospice during the selected time period |
| All FFS | Average length of home health stay (in days) for all patients admitted to and discharged from the listed hospice during the selected time period | |
| Average Reimbursement | Non-Risk Adjusted - This ACO | Average Medicare spend per admission for the selected ACO's assigned lives admitted to the listed hospice during the selected time period |
| Non-Risk Adjusted - All FFS | Average Medicare spend per admission for all patients admitted to the listed hospice during the selected time period | |
| Risk Adjusted - This ACO | Average risk-adjusted Medicare spend per admission for the selected ACO's assigned lives admitted to the listed hospice during the selected time period | |
| Risk Adjusted - All FFS | Average risk-adjusted Medicare spend per admission for all patients admitted to the listed hospice during the selected time period |
Patient Population tab
The Patient Population tab has a single table that shows the counties of residence for ACO beneficiaries for the selected ACO.
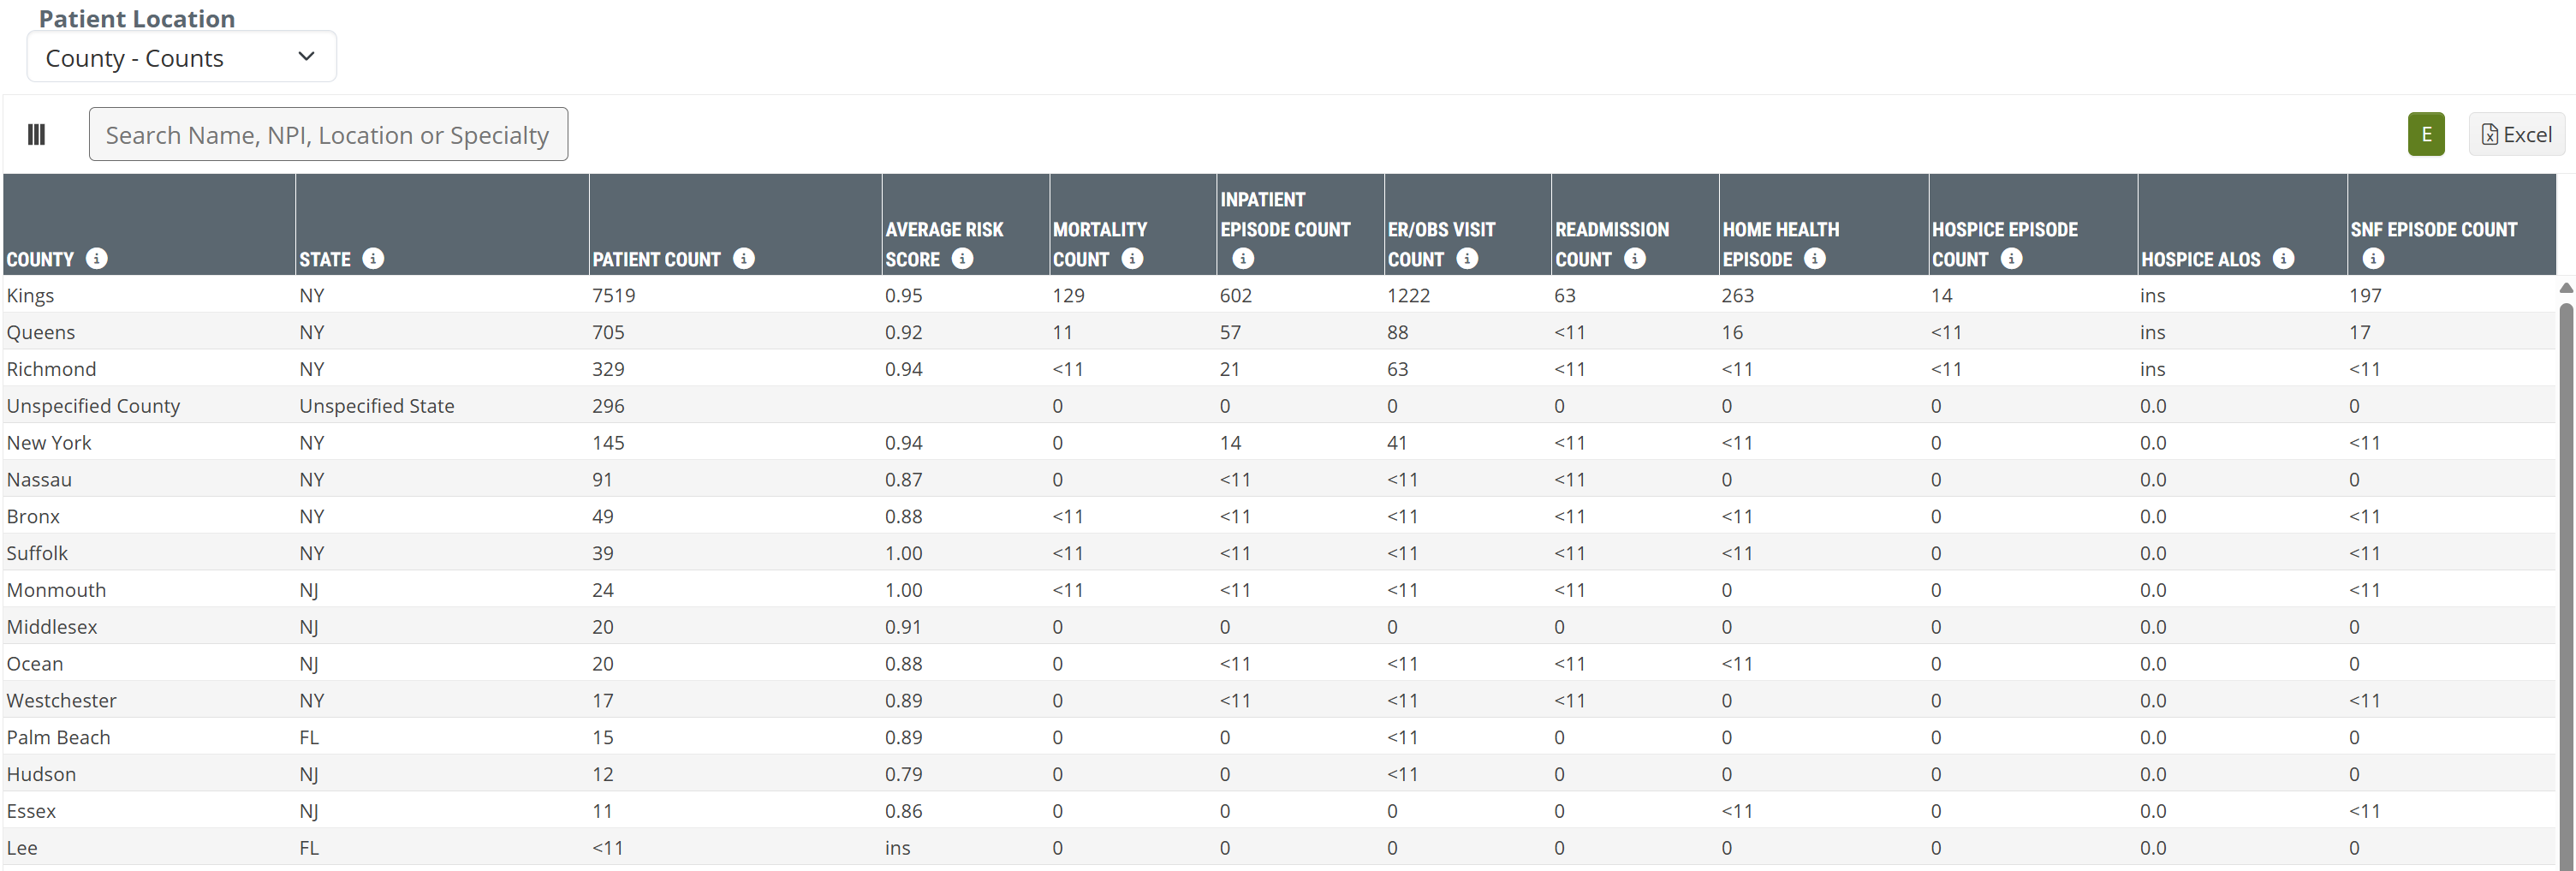
Metric Type Dropdown
| The dropdown at the top-left of the table allows you to select whether the table shows patient counts or patient percentages for the counties included in the table. | 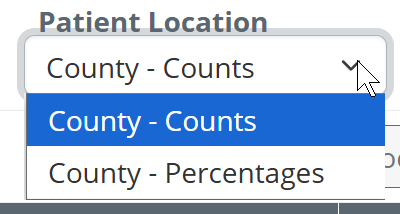 |
| Metric Name | Description |
| County | The county of ACO beneficiary residence during the year the claim was filed |
| State | The state of ACO beneficiary residence during the year the claim was filed |
| Patient Count | The count of unique beneficiaries who were assigned to the selected ACO and who reside in the listed county |
| Average Risk Score | Average risk score for beneficiaries who are assigned to the selected ACO and resided in the listed county |
| Mortality Count | The count of mortalities who were assigned to the selected ACO and resided in the listed county |
| Inpatient Episode Count | The count of unique inpatient episodes admitted during the selected year for beneficiaries who are assigned to the selected ACO and who reside in the listed county |
| ER/OBS Visit Count | The count of unique ER or observation visits during the year for beneficiaries who are assigned to the selected ACO and reside in the listed county |
| Readmission Count | The count of distinct All-Cause readmissions during the performance year for beneficiaries who are assigned to the selected ACO and who reside in the listed county, who were discharged from an Inpatient non-IRF facility within 30 days prior to readmission. |
| Home Health Episode (Count) | The count of distinct home health episodes admitted during the year for beneficiaries who are assigned to the selected ACO and who reside in the listed county |
| Hospice Episode Count | The count of distinct hospice episodes admitted during the year for beneficiaries who are assigned to the selected ACO and who reside in the listed county |
| Hospice ALOS | The average length of stay (in days) for hospice episodes of beneficiaries who are assigned to the selected ACO and who reside in the listed county. This calculation is limited to episodes discharged during the performance year. |
| SNF Episode Count | The count of distinct SNF episodes admitted during the year for beneficiaries who are assigned to the selected ACO and who reside in the listed county |
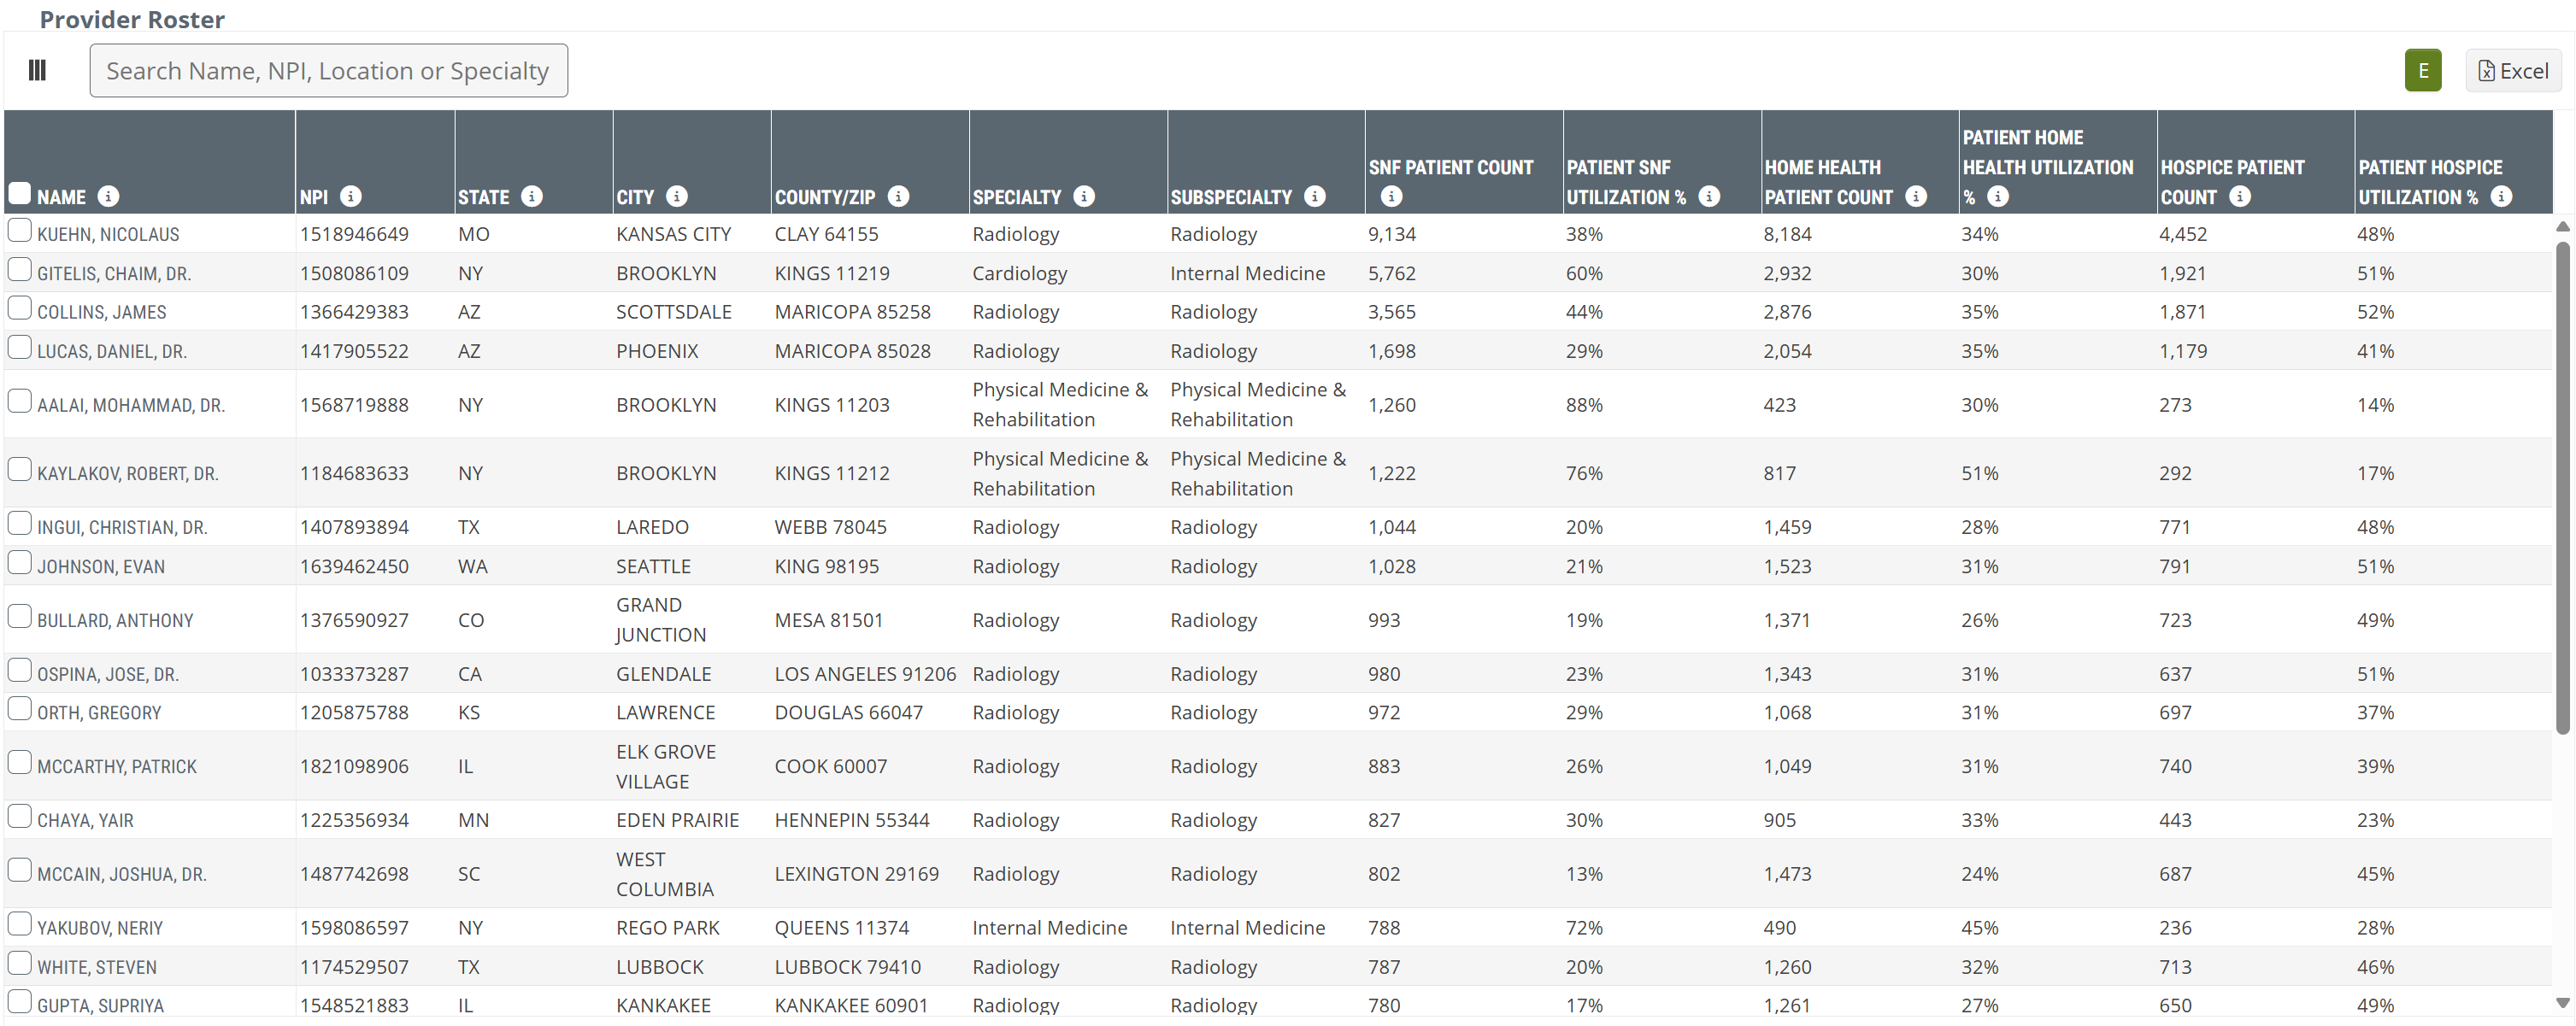
Participating Providers tab
The Participating Providers tab has a single table that contains a list of providers associated with the selected ACO.
Metric Name |
Description |
| Name | The physician name, as listed in CMS Provider Data (NPI) file |
| NPI | The NPI for the listed physician |
| State | The primary state in which the listed physician practices (as listed in the NPI file) |
| City | The primary city in which the listed physician practices (as listed in the NPI file) |
| County/ZIP | The primary county and ZIP code in which the listed physician practices (as listed in the NPI file) |
| Specialty | The listed physician's self-reported primary specialty (as listed in the NPI file) |
| Subspecialty | The listed physician's self-reported primary subspecialty (as listed in the NPI file) |
| SNF Patient Count |
The count of the listed physician’s patients who were admitted to skilled nursing care during the one-year reporting period
|
| Patient SNF Utilization % | The percentage of the listed physician's patients who were admitted to skilled nursing care during the one-year reporting period |
| Home Health Patient Count | The count of the listed physician’s patients who were admitted to home health care during the one-year reporting period |
| Patient Home Health Utilization % | The percentage of the listed physician's patients who were admitted to home health care during the one-year reporting period |
| Hospice Patient Count | The count of the listed physician’s patients who were admitted to hospice care during the one-year reporting period |
| Patient Hospice Utilization % | The percentage of the listed physician's patients who were admitted to hospice care during the one-year reporting period |
PMPM Details
When you click on the PMPM "Details" button, a sub page appears:
This subpage has two sections. The top section pertains to the ACOs PMPM spend. The lower section is a table of all ACO physicians.
ACO Spend
This page of details is focused on ACO spend, annual totals and monthly trends.
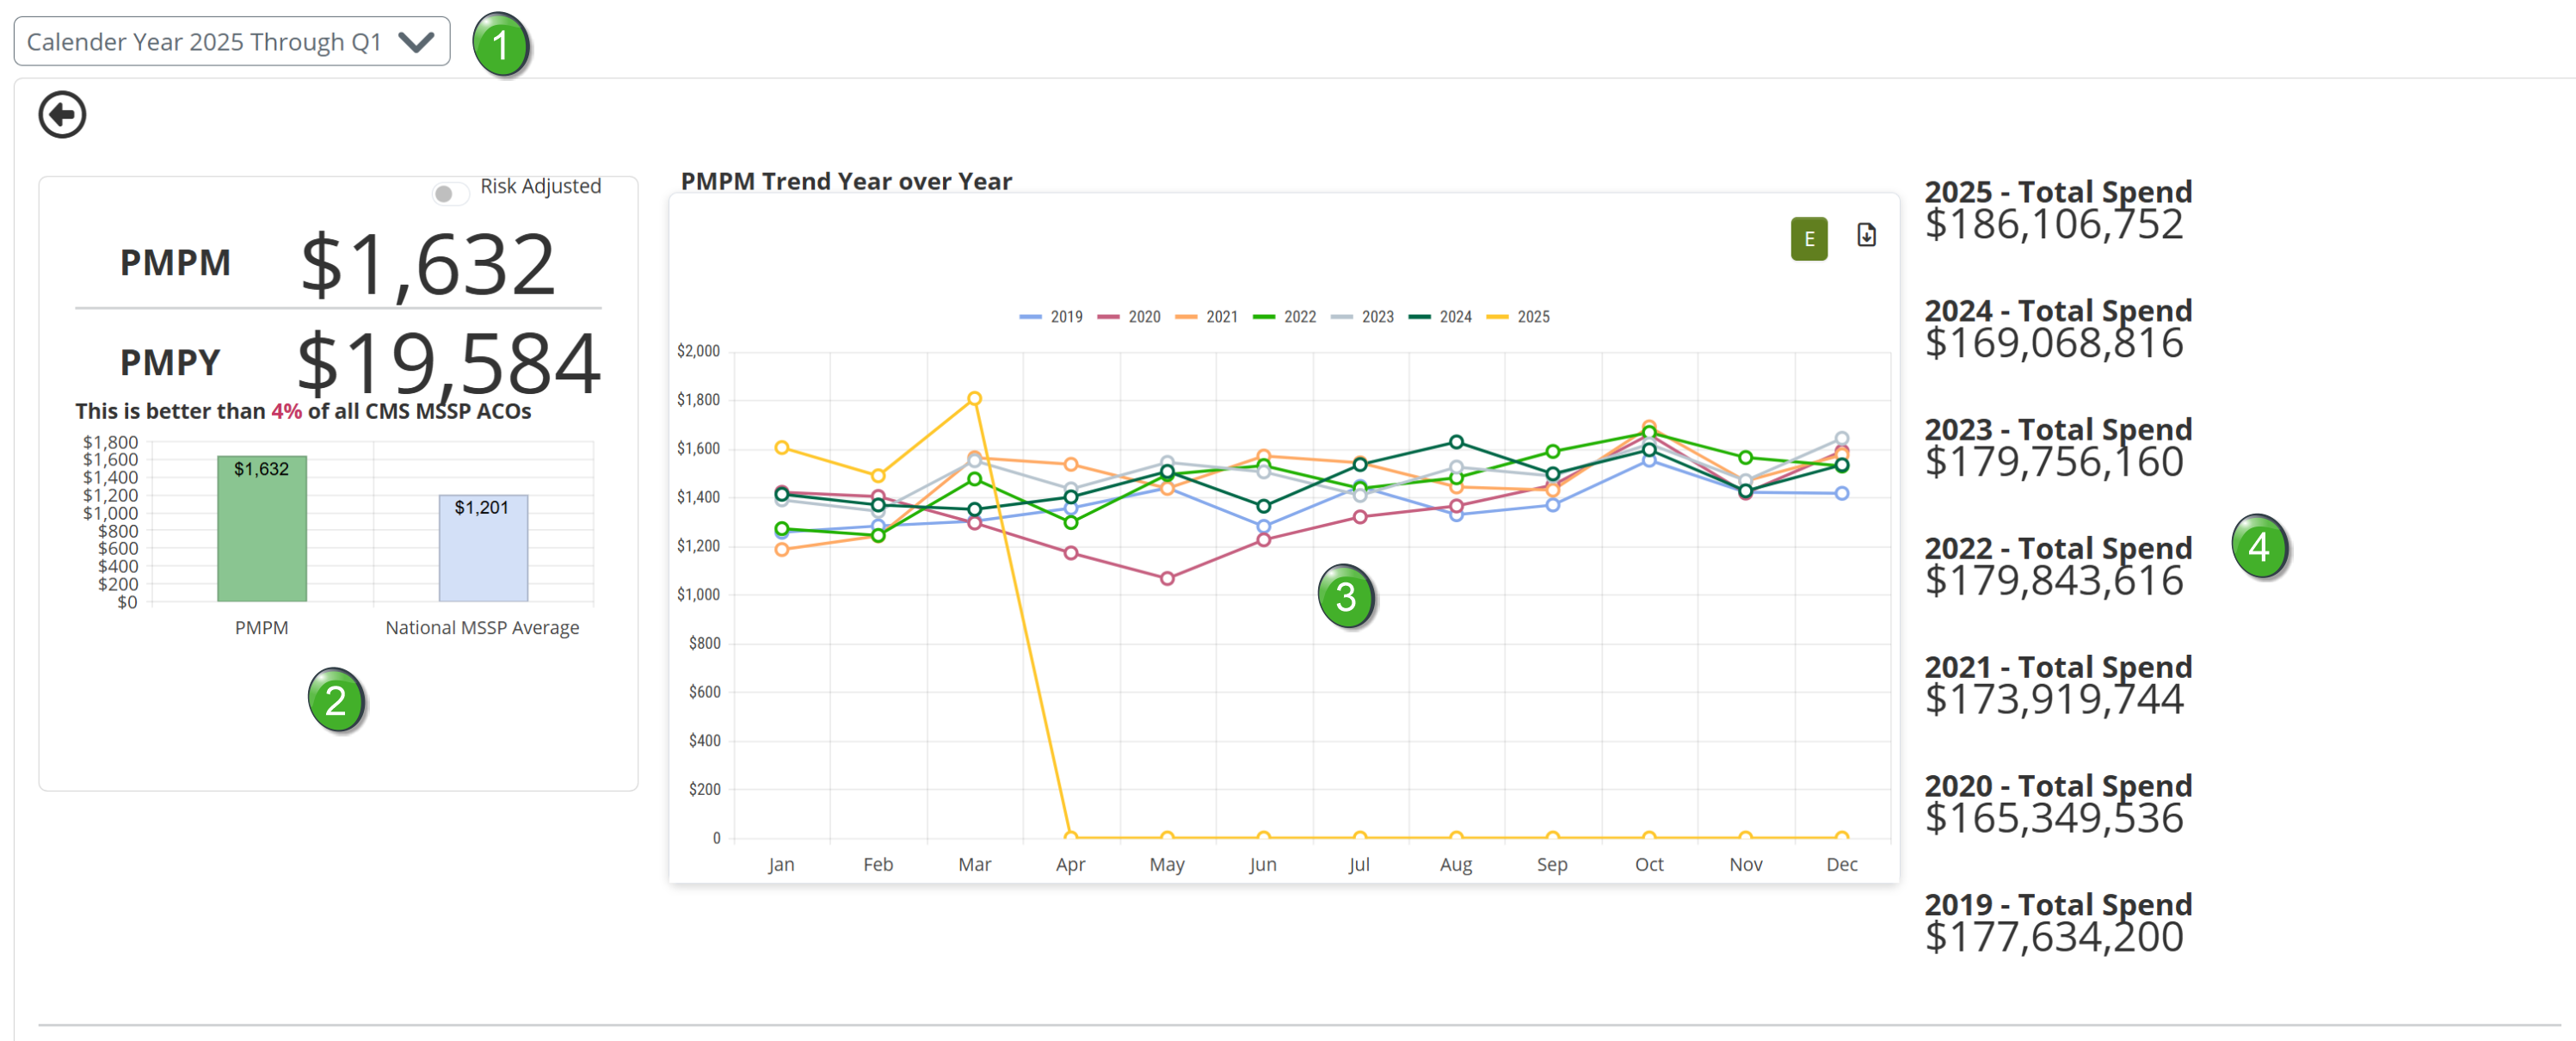
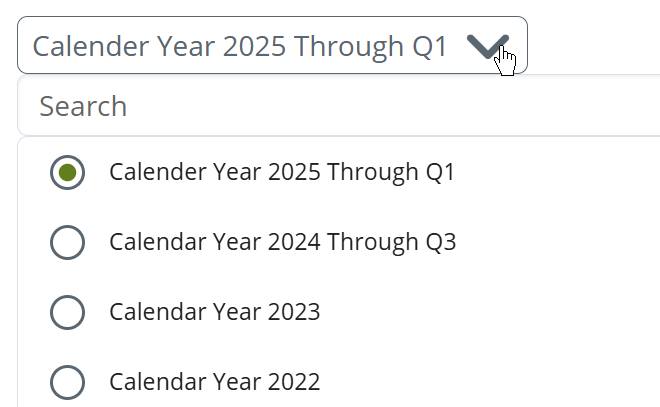
![]() The Calendar Year dropdown will allow you to choose which calendar year is displayed on the page. This will allow you to make far reaching historical analysis of the selected ACO.
The Calendar Year dropdown will allow you to choose which calendar year is displayed on the page. This will allow you to make far reaching historical analysis of the selected ACO.
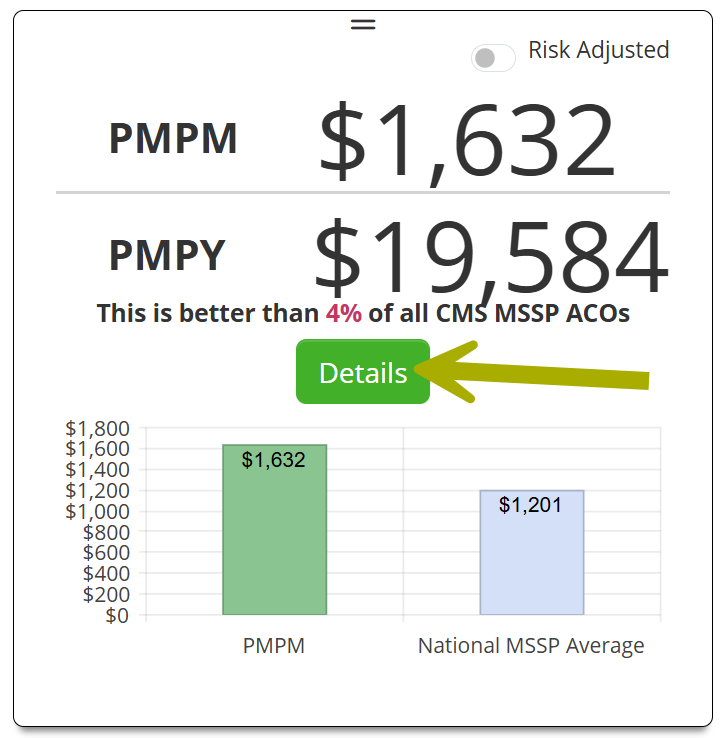
![]() The PMPM Tile is the same as what was displayed under the insights tab.
The PMPM Tile is the same as what was displayed under the insights tab.
![]() The chart shows the trend of monthly PMPM spend for the selected calendar year and for the previous six years.
The chart shows the trend of monthly PMPM spend for the selected calendar year and for the previous six years.
If you click on one of the circles in the chart, a pop-up will show the actual numbers for the selected month.
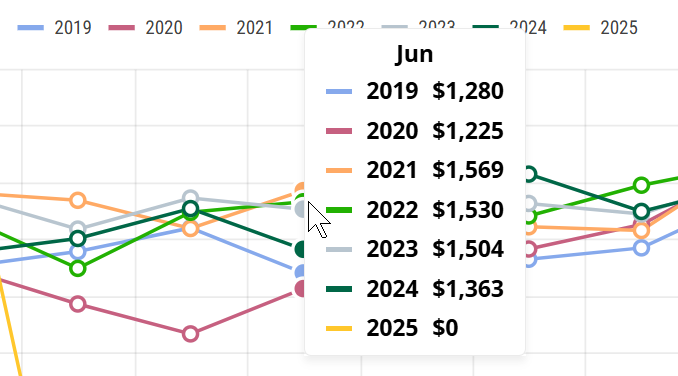
![]() Since the chart shows the calendar year rather than a rolling four quarters, any unreported quarters will be shown as zeros in the chart.
Since the chart shows the calendar year rather than a rolling four quarters, any unreported quarters will be shown as zeros in the chart.
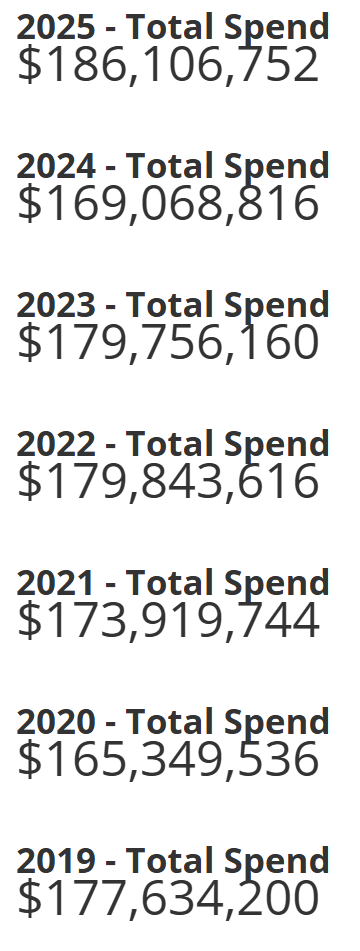
![]() To the right of the chart you will find the ACOs total patient spend for each year shown in the chart.
To the right of the chart you will find the ACOs total patient spend for each year shown in the chart.
Physician Table
The table includes summary metrics for all physicians in the ACO.

| Metric name | Description |
| Name | The physician's name |
| NPI | The physician's NPI |
| State | The state listed in the physician's primary practice address from the NPI registry |
| City | The City listed in the physician's primary practice address from the NPI registry |
| County/ZIP | The county/ZIP code listed in the physician's primary practice address from the NPI registry |
| Specialty | The physician's self-reported primary specialty from the NPI Registry |
| PMPM-All | This column contains the total per member, per month spend for all patients for whom the physician is listed as the attending or performing physician on a FFS claim during the performance year (PMPM) |
| Beneficiary Patient Count - All | This metric is the count of patients for whom the physician is listed as the attending or performing physician on a FFS claim in the performance year |
| Risk Score - All | The average HCC Risk Score of patients for whom the physician is listed as the attending or performing physician on a FFS claim in the performance year |