Summary
Risk Scores are calculated in accordance with specific and detailed parameters defined by CMS, which include factors such as patient diagnoses and demographics. The Risk Score number can be used to evaluate a specific provider or to compare different providers. In general, a higher number is indicative of a provider that treats patients with greater acuity, that is, patients needing more extensive care.
![]() Although you can use Risk Scores to evaluate and compare providers, the primary use of the Risk Score is to adjust patient costs to make comparison between providers equitable. You expect a provider that treats more acute patients to incur greater costs - Risk Scores allow us to adjust costs so comparisons are more "fair."
Although you can use Risk Scores to evaluate and compare providers, the primary use of the Risk Score is to adjust patient costs to make comparison between providers equitable. You expect a provider that treats more acute patients to incur greater costs - Risk Scores allow us to adjust costs so comparisons are more "fair."
For those of you who want more detail, see below.
Overview
Not all performance metrics are created equally. Comparing performance scores across different providers is a tricky task. If one provider has a much more severe patient population, that population characteristic must be considered. There are two ways to do this:
- Calculate risk scores on patient populations
- Adjust the performance scores directly
Trella Health uses CMS’s Hierarchical Condition Category (HCC) model to calculate Risk Scores. CMS developed HCC to determine equitable “premium” payments for payers offering Medicare Advantage plans. In other words, what’s a fair monthly reimbursement rate payable by CMS to the MA plan to insure a given patient. Using the model, each patient receives a Risk Score based on data from the prior year. The Risk Score incorporates diagnosis codes and other patient demographics such as age, type of residence, and eligibility for Medicaid. Since the goal of the model is to predict future health care costs, long-term conditions such as diabetes, have a greater impact on the Risk Score. Acute illnesses or injuries are less likely to generate ongoing healthcare costs, and thus are weighted less in the model.
The HCC risk scores are used to adjust cost relative to other NPIs of the same provider type. Adjusted costs allow for better comparison across NPIs with different risk scores because it accounts for the increased cost of patients with chronic conditions. For example, NPIs with a higher than average risk score will have a reduced adjusted cost since they have sicker patients, and NPIs with lower risk scores have increased adjusted cost.
![]() Trella Health calculates new Risk scores for providers as part of our new metrics for each data release.
Trella Health calculates new Risk scores for providers as part of our new metrics for each data release.
![]() For more background on CMS and Risk Adjustment see the Report to Congress.
For more background on CMS and Risk Adjustment see the Report to Congress.
Using the Risk Scores
In general, Risk Scores provide insight into the amount of care that can be expected for a patient population, and it helps calibrate a provider’s performance relative to its peers.
For referral sources, higher Risk Scores coupled with a normal Home Health Utilization rate and higher Hospitalization or Readmission rates signals an opportunity for increasing the amount of home health care within that referral source’s patient population.
For Home Health agencies, the Risk Scores provide another metric for strengthening competitive differentiation. If an agency can show that they provide similar outcomes for higher risk patients, the agency has a strong case for being a preferred provider.
Understanding the Metrics
Provider Risk Scores
Trella Health uses the provider’s patient population to determine that provider’s average Risk Score and Risk Score Category. Providers with a higher Risk Score are caring for patients that are typically associated with higher hospitalization rates and readmission rates, and require a higher total cost of care in general, as compared to their peers with lower risk scores. The Risk Score Category is determined using national benchmarks by provider type so you can more easily determine relative risk for a provider. The distinct provider types are physician, hospital, SNF, home health, and hospice.
Risk Score Categories
Categories are assigned for providers at or below the listed Risk Score. (The actual numbers have ten decimal places - we show rounded numbers.)
Level |
Percentile |
Numbers for Q1 2021 Data | |||||
| HHA | HOS | INP | OUTP | PHYS | SNF | ||
| Very Low | Bottom 10 (≤ 10th) | 1.94 | 1.47 | 1.46 | 1.14 | 1.02 | 2.18 |
| Low | 10th to 29th | 2.27 | 1.89 | 1.92 | 1.42 | 1.32 | 2.57 |
| Medium | 30th to 70th | 2.68 | 2.37 | 2.35 | 3.28 | 2.12 | 3.13 |
| High | 71st to 90th | 3.15 | 2.71 | 2.74 | 4.09 | 2.83 | 3.66 |
| Very High | Top 10 (≥ 90th) | Above 3.15 | Above 2.71 | Above 2.74 | Above 4.09 | Above 2.83 | Above 3.66 |
| Mean | 2.53 | 2.12 | 2.14 | 2.50 | 1.82 | 2.89 | |
| Minimum | .32 | .39 | .156 | .24 | 0 | .32 | |
| Maximum | 11.91 | 8.33 | 6.98 | 16.84 | 18.68 | 13.34 | |
![]() It is important to remember that the actual range of numbers from which we calculate the numbers that we use for the percentiles change between providers and from quarter to quarter. For example, the bottom tenth will be different if the range is 0-15 than if the range is 0-12. We use percentiles because the comparative value is unchanging even if the calculated risk score range or the number of providers change.
It is important to remember that the actual range of numbers from which we calculate the numbers that we use for the percentiles change between providers and from quarter to quarter. For example, the bottom tenth will be different if the range is 0-15 than if the range is 0-12. We use percentiles because the comparative value is unchanging even if the calculated risk score range or the number of providers change.
![]() Bottom line - focus on the Risk Category - the numbers are a reference.
Bottom line - focus on the Risk Category - the numbers are a reference.
Deviations from CMS Methodology
Physician Groups
Risk Scores for physician groups are calculated based on all physicians' FFS patients for a selected physician group, not just ACO-aligned lives. For that reason, the risk score for a physician group will not be the same as their ACO risk score.
 Risk Scores for Physician Groups
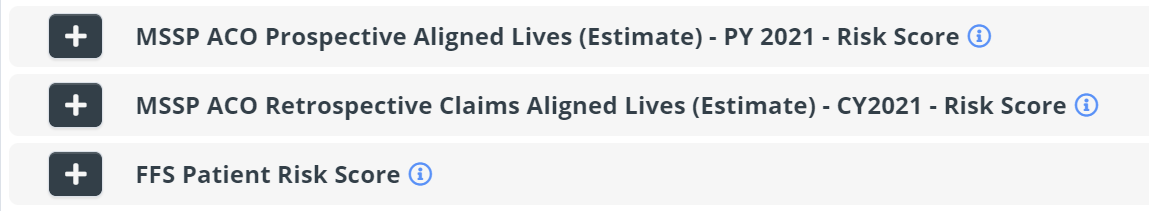
There are three different risk score metrics available on the Physician Groups Explore page:
- MSSP ACO Prospective Aligned Lives (Estimate) - PY 20XX - Risk Score - This is the average Hierarchical Condition Category (HCC) Patient Risk Score for estimated MSSP prospective aligned lives during PY 2021. While CMS provides beneficiary to ACO assignment, Trella provides beneficiary to physician group alignment estimates using CMS' methodology. Estimations built using claims filed during the prospective alignment period (10/01/2018 - 09/30/2020) and CMS MSSP Assignment Methodology v8
- MSSP ACO Retrospective Claims Aligned Lives (Estimate) - CY2021 - Risk Score - This is the average Hierarchical Condition Category (HCC) Patient Risk Score for estimated MSSP CY2021 retrospective claims aligned lives, using CMS MSSP Assignment Methodology v8
- FFS Patient Risk Score - This metric is the average Hierarchical Condition Category (HCC) Patient Risk Score for the listed physician group
![]() The following image is from the "Add Metrics" interface on the Physician Groups Explore page.
The following image is from the "Add Metrics" interface on the Physician Groups Explore page.
 No Metric
If there is no risk score shown for a specific physician group, the listed group did not have any claims during the alignment window for Prospective PY 20XX alignment. Since there were no claims, we can't calculate a risk score.
Additional Limitations
Our Risk Score is not going to match CMS’ exactly, for a few reasons:
-
We cannot identify ESRD patients exactly the same way CMS does, so our Risk Score does not reflect this portion of the methodology perfectly.
-
We cannot identify patients who are institutionalized. This makes up a smaller piece of the HCC Methodology, but it is a blind spot we have and causes us to not get the exact same results as CMS.
-
For the reasons above, we do not use CMS’ normalization factor but our own.
-
Different CMS programs have their own methodology, which we have not implemented – ours is just the HCC Methodology, with the three caveats above.
-
Our choice to publish our own Risk Score was initially made for the Total Cost of Care report; we advised that it was not ideal to use it for ACO data for financial calculations. That recommendation stands – these data are intended to give users a general idea of the type of patients a provider cares for and are not intended to be plugged in to rigorous actuarial functions.
Risk Adjusted Readmission Rates
Risk scores calculated according to the HCC model are used in adjusting patient costs.
We also make a risk adjustment on readmission rates in some tables. These are adjusted using a number of criteria including:
- Enrollment metrics
- Demographic information
- ZIP code
- Diagnostic codes
- Prior costs.
This regression model is based on widely used statistical analysis used throughout healthcare based on the latest research.
![]() Do not use a Risk Score included in a table to understand Risk Adjusted Readmission Rates.
Do not use a Risk Score included in a table to understand Risk Adjusted Readmission Rates.
![]() One final difference. Risk Scores are prospective, meaning that the HCC model is designed to produce a future projection. Other Risk Adjusted metrics are calculated from a model that is concurrent with current metrics.
One final difference. Risk Scores are prospective, meaning that the HCC model is designed to produce a future projection. Other Risk Adjusted metrics are calculated from a model that is concurrent with current metrics.