Overview
Patient Acuity measures the level of effort required by providers to care for a patient. This is important because differing acuity levels change a provider’s staffing, workforce education, and overall workload. For post-acute providers, this stands out because those agencies that are capable of caring for patients with higher acuity must increase their investments, whereas agencies that do not make the same investment are not prepared to handle such patients.
Therefore, provider performance, as measured by patient outcomes, should be evaluated based, in part, on patient acuity. This will separate those agencies capable of managing complex patients from those that specialize in lower complexity patients.
Usage
The use of the acuity measure is to further delineate performance in more specific patient groups. Without the acuity measurement, all patients are grouped together which makes the performance difficult to compare across agencies. If an agencies has a higher percentage of highly complex, high acuity patients, it is to be expected that their overall patient outcomes would be inferior to those of agencies with a higher percentage of low complexity, low acuity patients. By grouping patients by acuity, agencies can be compared according to how they are performing with patients of varying complexity.
Further, since acuity can be applied across diagnostic groupings, agencies can compare themselves to performance not only by acuity, but acuity within a diagnostic group. Thus, if an agency is attempting to educate a hospital on their services, and the agency performs well with high acuity patients, especially in a difficult diagnostic category (eg. Cardiac), the best way for the agency to advertise their performance may be measured by a patient population in a specific acuity and diagnosis. By comparing their performance, as measured by hospitalization rates, within certain diagnostic and acuity groups, an agency can clearly differentiate their performance versus their peers. This delivers a strong value proposition message to hospitals and physicians alike.
Understanding the Metrics
How we calculate Acuity

Acuity Measures
As seen in the image above, Trella Health has grouped patients into acuity levels of “Low”, “Medium”, and “High”. These levels are determined by measuring patients’ healthcare utilization for the one year prior to their post-acute admit. There are two factors that contribute to a patient’s healthcare utilization:
- Cost associated with institutional claims - For each patient, Trella Health calculates the reimbursement to institutions over the prior year. This includes Medicare payments made to facilities including hospitals (both inpatient and outpatient), skilled nursing, hospice, and home health.
- Number of hospital visits, weighted by type - For each patient, Trella Health calculates the number of visits to a hospital in the year prior and creates a hospital utilization score. This score calculated by weighting each visit type as follows:
|
Type of Visit |
Weight |
|
In-patient (excluding Joint DRGs) |
2 |
|
In-patient (Joint DRGs) |
1.5 |
|
Outpatient Observation |
1.5 |
|
Emergency Department |
1 |
![]() The weight for in-patient “Joint” DRGs was reduced to diminish the impact of expensive knee and hip replacements overstating patient acuity.
The weight for in-patient “Joint” DRGs was reduced to diminish the impact of expensive knee and hip replacements overstating patient acuity.
Determining Acuity: Low, Medium High
We used the two measures described above (cost and utilization) to determine our acuity measures. To do this we plotted a graph with total cost on the X-Axis and Hospital Utilization on the Y-Axis. are combined and plotted on a graph with the x axis indicating the total cost, and the y axis indicating the hospital utilization. Then, to determine the “Low”, “Medium”, and “High” groups, lines were drawn on the diagonal across the distribution of patients.
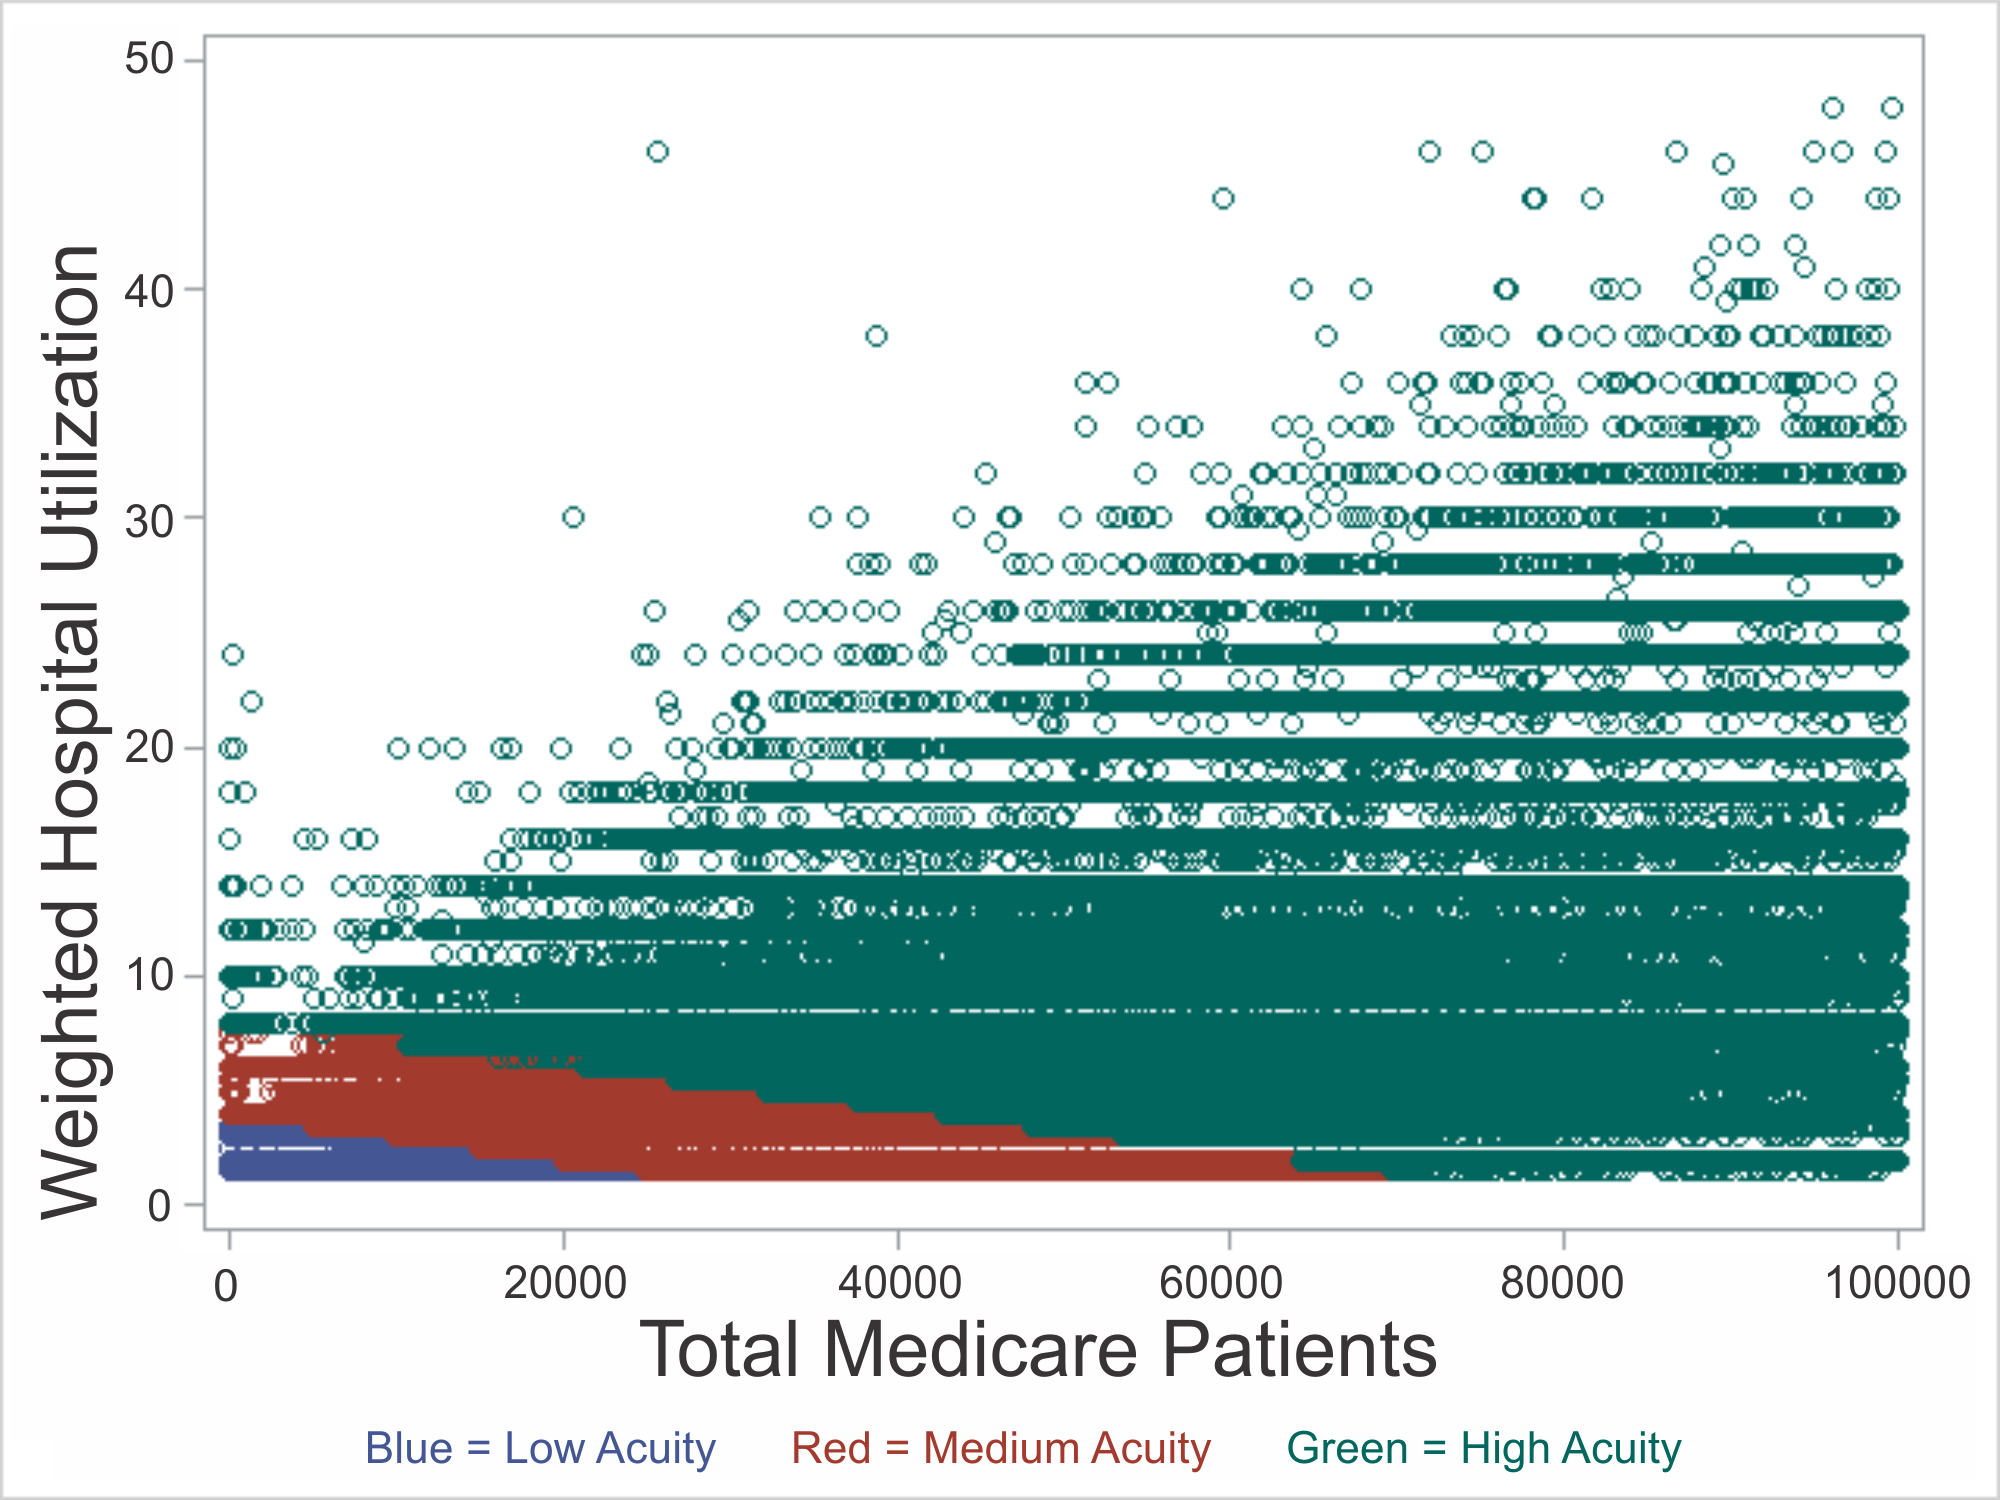
In the image above, while the blue patients appear scant, in fact that corner is densely populated, as you can see in the national summary table that follows:
National Summary
In the table below, there is a strong relationship between patient acuity and readmit rate. For each diagnostic group, you can see the readmit rate trends higher as the patient acuity increases. Similarly, you can see the length of the preceding in-patient stay increases as well.

This table summarizes the patient acuity metrics by diagnostic group for patients that were discharged from an inpatient stay and received post-acute care within 14 days.